- About
-
Solutions
-
Services
-
Biosciences
- PureDisc™ Enabled Membrane Protein Production
- Assay Development and Transfer
- Biochemistry / Enzymology
- Biomarker Services
- Biophysics
- Cell-Based Assays
- Compound screening and cascade design
- Cryo-EM
- Fibrosis Assays
- Project Management and Consultancy Services
- Protein Expression
- Structural Biology
- X-ray Crystallography
- Chemistry
- Integrated Drug Discovery
- Computer Aided Drug Design
- Hit ID and Screening Services
- DMPK Services
-
Biosciences
- Target Classes and Modalities
- Therapeutic Areas
-
A-Z
- A
- B
- C
- D
- E
- F
- G
- H
- I
- K
- L
- M
- N
- O
- P
- R
- S
- T
- V
- X
-
Services
- Library
- News & Events
- Careers
- PureDisc™
Caco-2 Permeability Assay
The Caco-2 assay is used to assess the permeability of drug candidates. Caco-2 cells are polarized human colorectal adenocarcinoma-derived cells, and a layer of these cells provides a model for the intestinal epithelium. Many drugs are administered orally, and so uptake across the intestinal epithelium (along with any efflux that occurs) determines the amount of drug reaching the site of action.
The Caco-2 cell layer separates two compartments containing Caco-2 cell media. Both apical-to-basal (A-B) and basal-to-apical (B-A) transport can be assessed. A greater degree of apical-to-basal transport indicates greater absorption, and greater basal-to-apical transport indicates potential efflux.
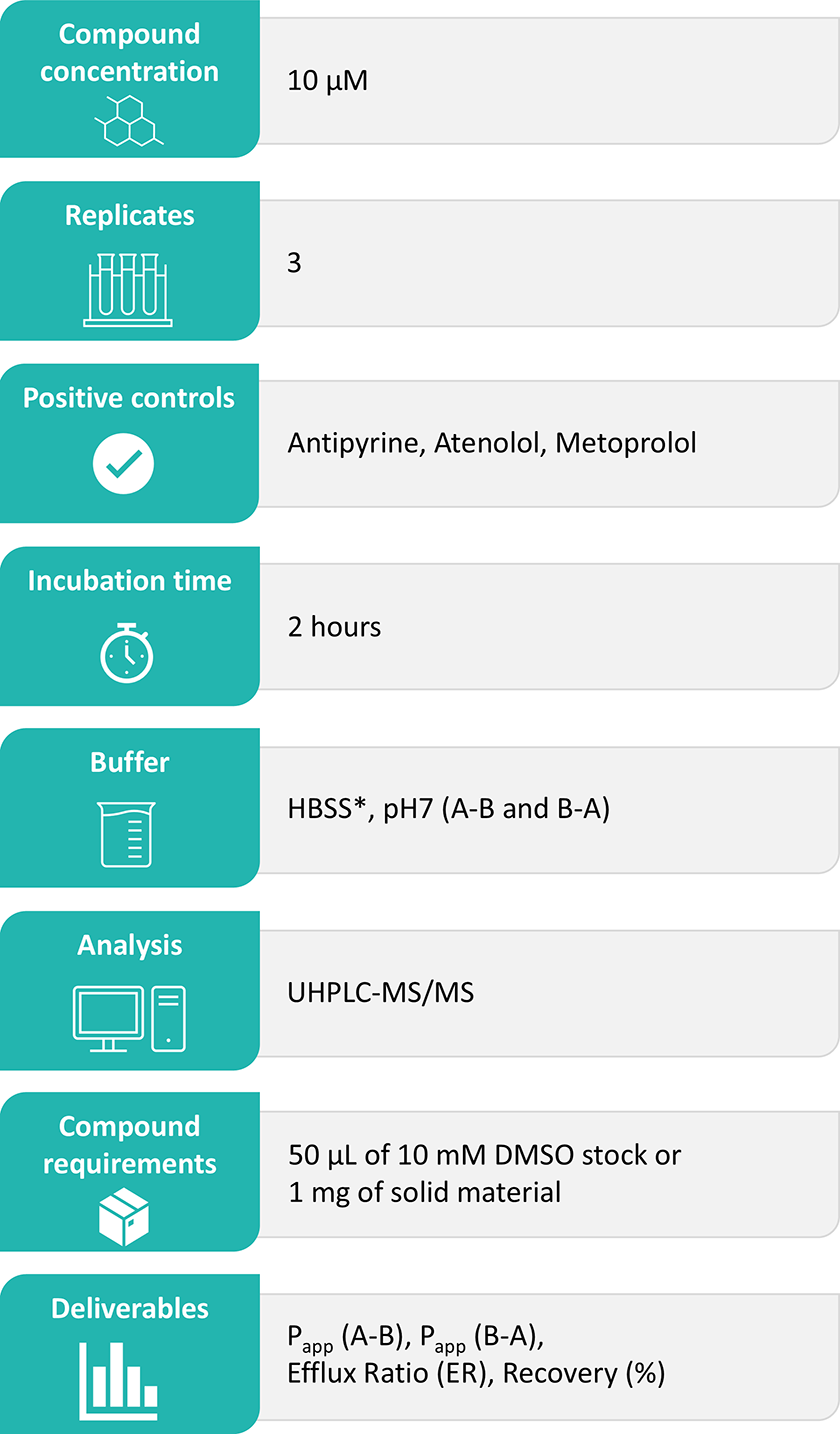
Domainex’s Standard Experimental Procedure:
Compound is dosed on one side of the Caco-2 cell barrier, either apical or basal. The plate is then incubated for 120 minutes at 37 °C. A sample is taken from both sides of the Caco-2 cell barrier, and levels of compound are quantified via Ultra-High Performance Liquid Chromatography (UHPLC)-Mass Spectrometry (MS) analysis.
Prior to incubation, the integrity of the Caco-2 barrier is checked via electrophysiological measurements. Following incubation, the integrity of the Caco-2 barrier is confirmed via a Lucifer Yellow Paracellular Permeability assay. Example data is shown in Figures 1 and 2.
Data Analysis:
Supernatants from both apical and basal chambers are analysed using Waters Acquity UHPLC TQ-S, TQS-micro or TQ-XS instruments. Triple quadrupole mass spectrometers, operated in multiple reaction monitoring (MRM) mode, provide accurate quantification with excellent sensitivity, selectivity and reproducibility.
Deliverables:
The results are reported in Excel file format as Papp(A-B, 10-6 cm/s), Papp(B-A, 10-6 cm/s), efflux ratio (ER) and compound recovery (%). Any relevant comments about compound stability/solubility/binding are also included in the report.
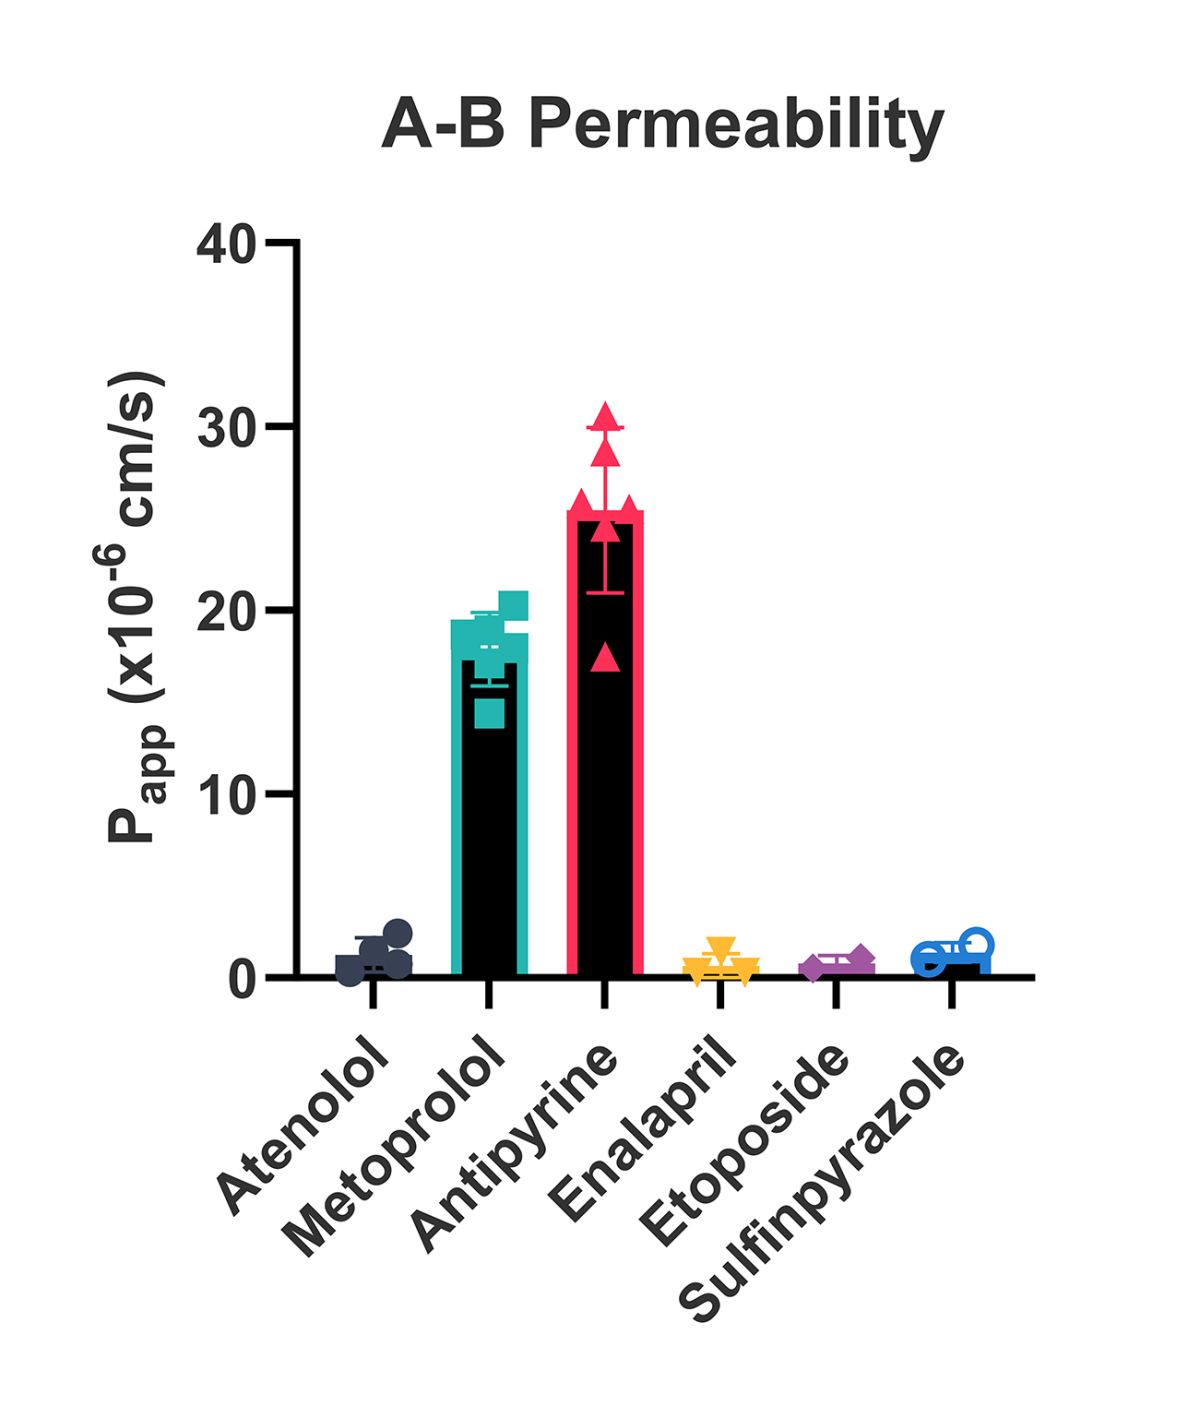
Figure 1: Typical results for A-B permeability.
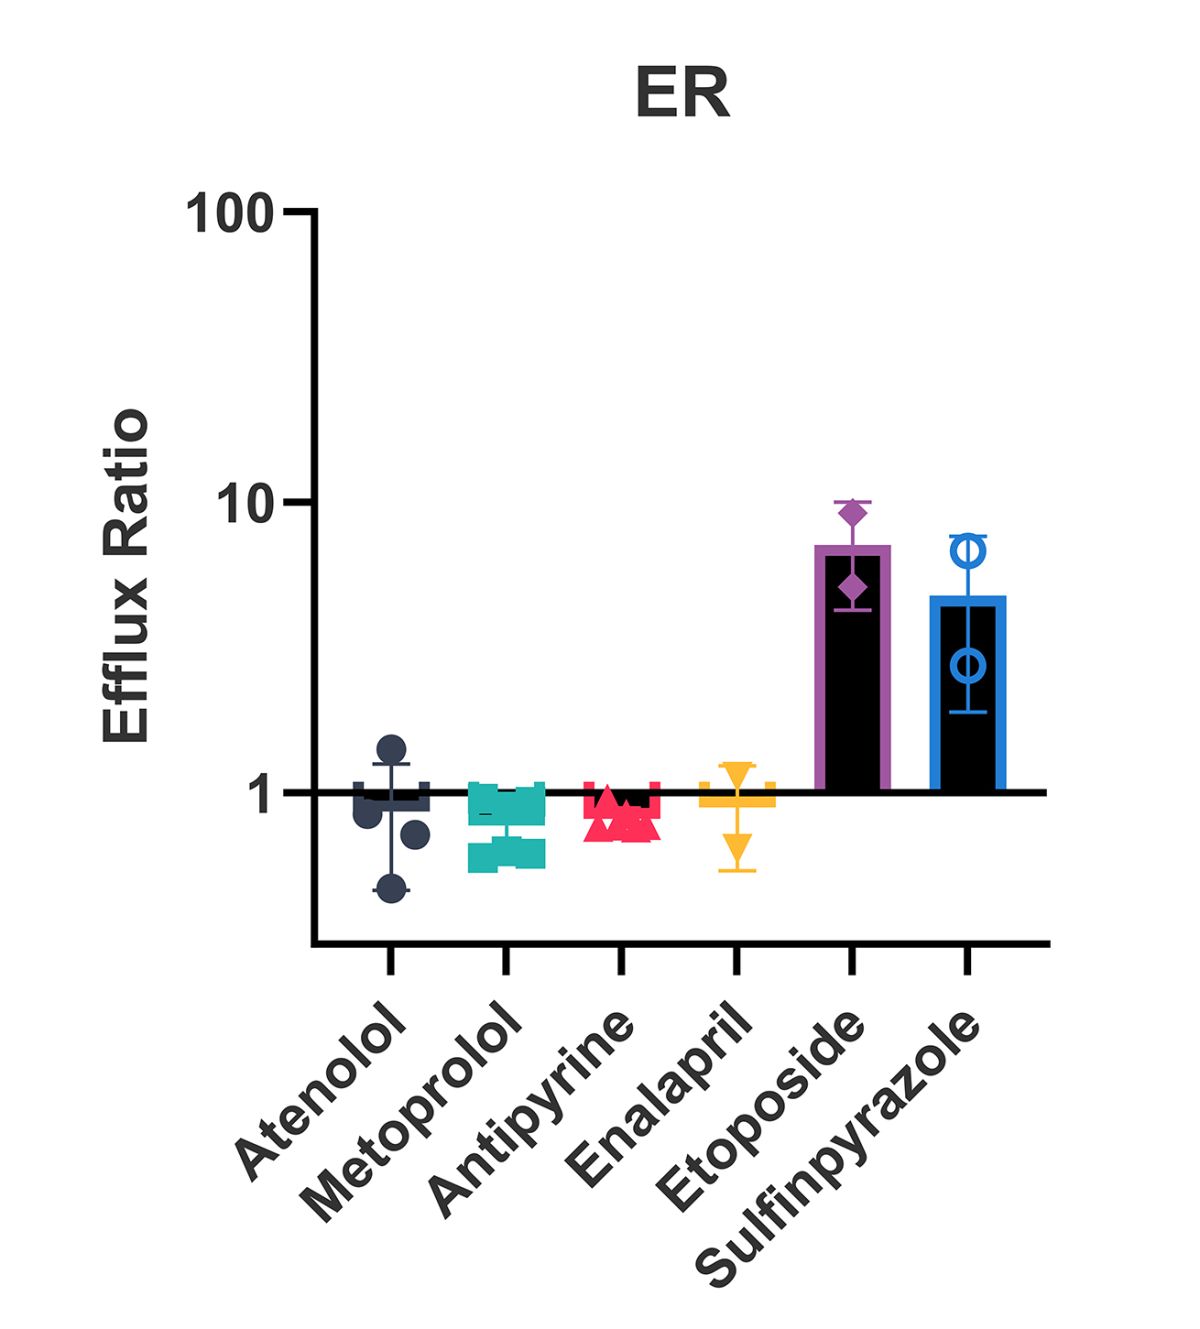
Figure 2: Efflux Ratios for a selection of compounds.
Start your next project with Domainex
Contact one of our experts today