- About
-
Solutions
-
Services
-
Biosciences
- PureDisc™ Enabled Membrane Protein Production
- Assay Development and Transfer
- Biochemistry / Enzymology
- Biomarker Services
- Biophysics
- Cell-Based Assays
- Compound screening and cascade design
- Cryo-EM
- Fibrosis Assays
- Project Management and Consultancy Services
- Protein Expression
- Structural Biology
- X-ray Crystallography
- Chemistry
- Integrated Drug Discovery
- Computer Aided Drug Design
- Hit ID and Screening Services
- DMPK Services
-
Biosciences
- Target Classes and Modalities
- Therapeutic Areas
-
A-Z
- A
- B
- C
- D
- E
- F
- G
- H
- I
- K
- L
- M
- N
- O
- P
- R
- S
- T
- V
- X
-
Services
- Library
- News & Events
- Careers

Flow Cytometry
Rapid, detailed characterisation of cells and particles
Flow Cytometry Services for Drug Discovery and Translational Research
Domainex provides flow cytometry services to support drug discovery and translational research programmes. Combining conventional and spectral flow cytometry with bespoke assay development, immune profiling and biomarker analysis, we generate high-quality single-cell data that enables informed scientific decision-making.
Whether you are assessing target engagement, characterising immune responses, investigating mechanism of action, identifying biomarkers or supporting PK/PD studies, our team develops fit-for-purpose flow cytometry assays tailored to your scientific objectives. From simple single-colour experiments to complex high-parameter analyses, our flow cytometry services help investigate critical biological questions throughout the drug discovery pipeline.
Flow Cytometry Applications and High-Parameter Analysis
From routine screening and cellular pharmacology studies to translational research, we use conventional and spectral flow cytometry to generate detailed cellular and functional data that supports informed project decisions.
Applications include:
- Immune profiling and cellular phenotyping
- Target expression and engagement studies
- Drug-induced cellular and immune response analysis
- Cell activation, intracellular signalling and cytokine profiling
- Cell proliferation, cell cycle and apoptosis assessment
- Ligand binding assays
- Rare cell population detection and characterisation
- Mechanism-of-action, biomarker and translational research studies
- Bespoke panel design and multiparametric assay development for conventional and spectral flow cytometry
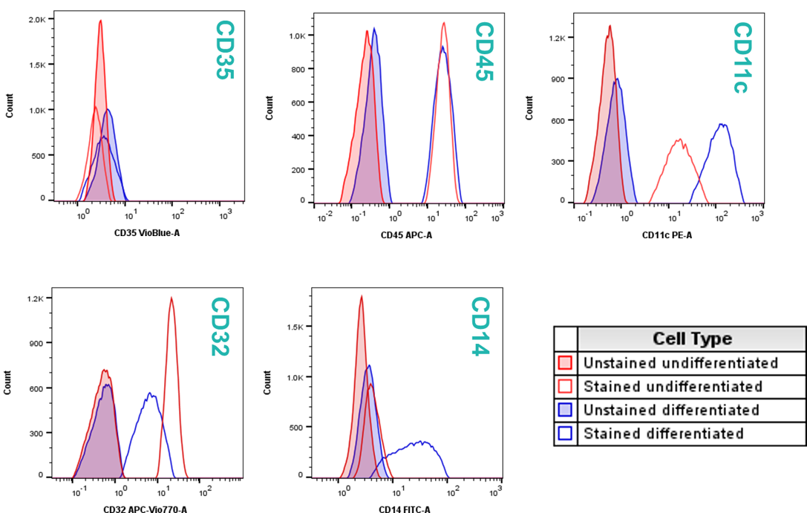
Figure 1. THP1 cells differentiated from a monocytic to macrophage-like phenotype using PMA. Cells were stained with a variety of fluorescently conjugated antibodies against key differentiation markers with histograms showing marker expression between the two cellular phenotypes alongside unstained controls.
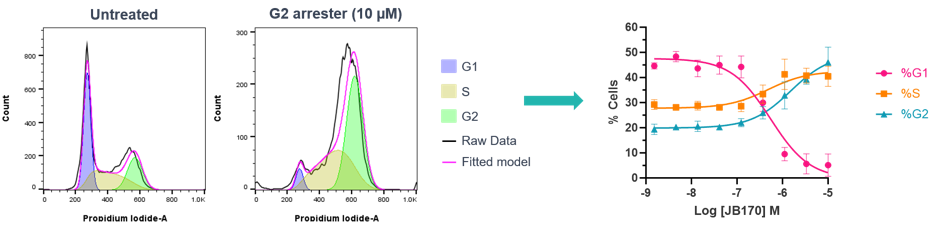
Figure 2. Cells were treated with a dilution-series of a small molecule compound expected to cause cell cycle arrest in G2 phase. Following treatment, cells were fixed and permeabilised and then stained with propidium iodide Data was analysed using FlowJo with the cell cycle analysis plugin used for analysis. Histograms show fitted model and clear G2 arrest with 10 µM compound. Data was used to generate concentration-response curves.
Flow Cytometry for Cell and Immune Profiling
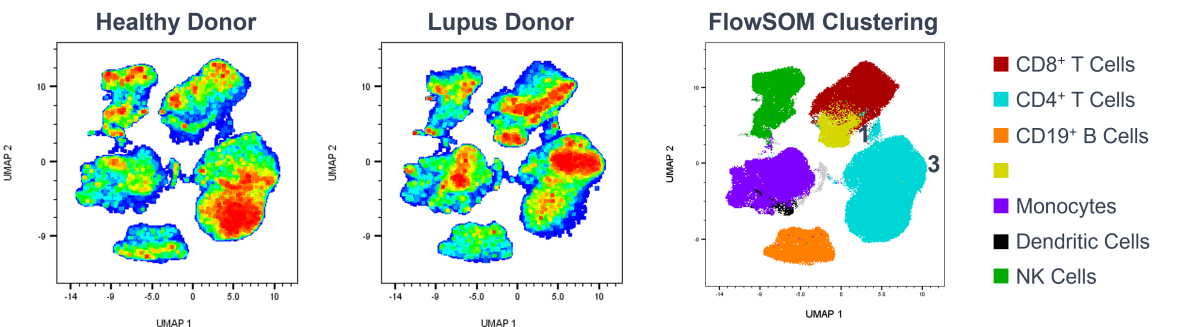
Figure 3: Altered immune cell subset distribution between healthy and lupus PBMC donors. A 17-colour staining panel was used to stain PBMCs from 1 healthy and 1 lupus donor, which were then acquired using a spectral flow cytometer (Cytek Aurora). UMAPs were generated based on lineage markers, with FlowSOM clustering then applied to identify immune cell populations. T cell populations (populations numbered 1, 2 and 3) show a clear difference in subset distribution between healthy and disease state donors.
Domainex provides detailed characterisation of cellular and immune populations across a wide range of sample types, enabling flexible study design across discovery and translational research programmes. Supported sample types include:
- Whole blood
- Peripheral blood mononuclear cells (PBMCs)
- Enriched cell subsets
- Primary human (healthy or disease state donors) and preclinical cells
- Immortalised and engineered cell lines
- Fresh or cryopreserved samples
Domainex can carry out both standard flow cytometry and spectral flow, which allows the assessment a large panels of markers in a single sample, providing unapparelled flexibility and specificity.
This flexibility is illustrated in Figure 3, where cryopreserved PBMCs from one healthy donor and one active lupus donor were analysed using a 17-colour spectral flow cytometry panel. The panel was designed to identify key immune cell subsets, including B cells, CD4+ and CD8+ T cells, and NK cells.
The resulting data enabled comparison of immune cell subset distribution between the healthy and lupus donor samples, highlighting differences in cellular composition and surface marker expression. This example demonstrates how, at Domainex, we use high-parameter flow cytometry to support immune profiling, disease-state comparisons and translational biomarker assessment.
For studies involving human biological samples, Domainex’s Human Tissue Authority (HTA) license for the storage of human tissue provides a robust regulatory and quality framework for appropriate sample handling, storage and processing.
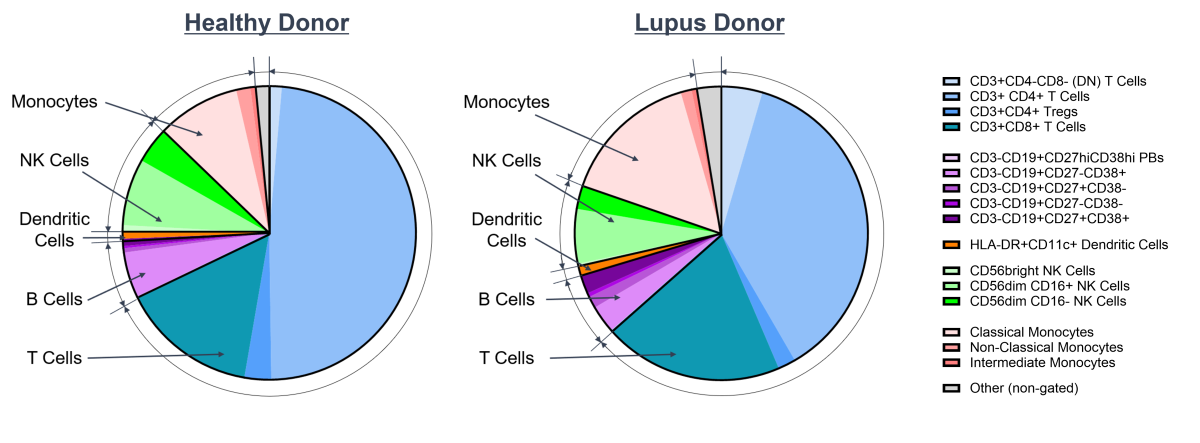
Figure 4: Pie chart showing altered cell subset distribution between healthy and lupus donors. Distribution of key immune cell compartments are shown, with further breakdown to specific subsets. Whilst top level populations appear to be similar between healthy and disease state PBMCs (i.e. T cells, B cells etc), intra-compartment distribution appears to be altered, e.g. increased CD3+CD4-CD8- T cells in T cell compartment, and increased CD27+CD38+ B cells in the lupus vs healthy donor.
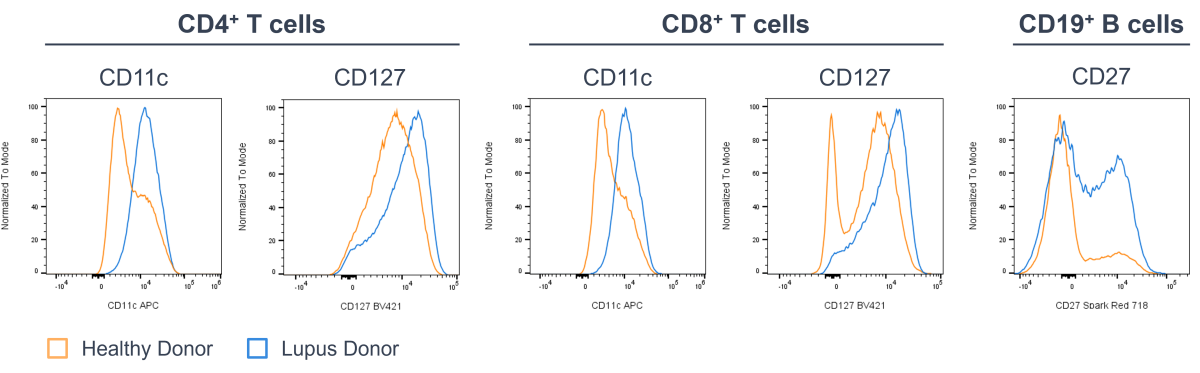
Figure 5: Differences in cell surface marker expression between healthy and lupus PBMC donors. Histograms show a difference in expression profiles of CD11c and CD127 on CD4+ and CD8+ T cells, and CD27 on CD19+ B cells between healthy (orange) and lupus (blue) donors.
Flow Cytometry Assay Development and Panel Design
Successful flow cytometry studies depend on robust assay design and carefully optimised staining panels.
Domainex develops custom flow cytometry assays tailored to specific project requirements, supporting applications ranging from immune phenotyping and target engagement to biomarker assessment and translational research. Our capabilities include assay optimisation, antibody selection, panel design and data interpretation for both conventional and spectral flow cytometry platforms.
We can develop entirely new assays and staining panels or optimise existing methods to meet project objectives.
Typical Flow Cytometry Workflow
Phase 1
Phase 2
Phase 3
Phase 4
Phase 5
Phase 6
Panel Design
Pair fluorophore brightness with antigen expression to maximise marker resolution
Minimise spectral overlap and spreading error to improve population separation
Incorporate a viability dye for accurate discrimination of live and dead cells
Staining Optimisation
Titrate antibodies and dyes to define optimal concentrations and resolution
Optimise staining conditions, including incubation time, temperature and fixation protocols
Standardise staining workflows to ensure reproducibility
Sample Preparation
Apply a consistent staining protocol across all samples
Include appropriate controls, such as non-stained, FMO and biological controls
Prepare single-stained controls for accurate compensation or spectral unmixing
Sample Acquisition
Perform daily instrument QC to ensure reproducibility across runs
Optimise detector settings and verify compensation or spectral unmixing
Acquire sufficient events to enable robust analysis of target and potential rare cell populations
Data Analysis
Data QC: Signal assessment, debris removal, doublet exclusion and live-cell gating
Population identification: Traditional gating or high-dimensional analysis
Control-guided analysis: Use FMOs and biological controls to optimise gate setting and ensure confidence in population identification
Output
Population visualisations (dot plots, histograms, tSNE, and UMAP), quantitative summaries and publication-ready figures
Results presented as plots, charts or statistical tables, showing population frequencies, cell counts and marker expression (MFI)
Phase 1 - Panel Design
Pair fluorophore brightness with antigen expression to maximise marker resolution
Minimise spectral overlap and spreading error to improve population separation
Incorporate a viability dye for accurate discrimination of live and dead cells
Phase 2 - Staining Optimisation
Titrate antibodies and dyes to define optimal concentrations and resolution
Optimise staining conditions, including incubation time, temperature and fixation protocols
Standardise staining workflows to ensure reproducibility
Phase 3 - Sample Preparation
Apply a consistent staining protocol across all samples
Include appropriate controls, such as non-stained, FMO and biological controls
Prepare single-stained controls for accurate compensation or spectral unmixing
Phase 4 - Sample Acquisition
Perform daily instrument QC to ensure reproucibility across runs
Optimise detector settings and verify compensation or spectral unmixing
Acquire sufficient events to enable robust analysis of target and potential rare cell populations
Phase 5 - Data Analysis
Data QC: Signal assessment, debris removal, doublet exclusion and live-cell gating
Population identification: Traditional gating or high-dimensional analysis
Control-guided analysis: Use FMOs and biological controls to optimise gate setting and ensure confidence in population identification
Phase 6 - Output
Population visualisations (dot plots, histograms, t-SNE, and UMAP), quantitative summaries and publication-ready figures
Results presented as plots, charts or statistical tables, showing pupulation frequencies, cell counts and marker expression (MFI)
Why Domainex? Biology-Led. Decision-Focused.
Our flow cytometry services combine tailored assay development with conventional and spectral flow cytometry to deliver biologically relevant data that supports informed decision-making.
- Custom flow cytometry assay development and panel design
- Conventional and spectral flow cytometry
- Primary cell, tissue and cell line capabilities
- HTA-licensed human tissue storage
- Translational research and biomarker capabilities
- Flexible support for exploratory and discovery-stage studies
- Integrated biology and drug discovery capabilities
From routine screening to complex translational studies, Domainex provides flow cytometry services that generate data to support drug discovery programmes.
Frequently Asked Questions
What is flow cytometry and how can it support drug discovery?
Flow cytometry is a single-cell analysis technique used to measure cellular markers and responses. It is widely used for target characterisation, immune profiling, mechanism-of-action studies and biomarker research.
When should I choose flow cytometry over other cell analysis techniques?
Flow cytometry is ideal when detailed single-cell data is needed, particularly for immune profiling, target expression analysis and rare cell detection.
What types of samples can be analysed using Domainex flow cytometry services?
Domainex supports whole blood, peripheral blood mononuclear cells (PBMCs), tissue-derived cells, enriched cell subsets, primary cells and cell lines. Both fresh and cryopreserved samples can be accommodated.
What sample quantities are required?
Requirements vary by assay and study design. We can advise on suitable sample volumes during project planning.
Can you work with cryopreserved samples?
Yes. Domainex routinely works with both fresh and cryopreserved samples.
Do you work with samples from disease-state donors?
Yes. Domainex supports studies using samples from both healthy and disease-state donors.
How does Domainex ensure appropriate handling of human biological samples?
Domainex holds a Human Tissue Authority (HTA) licence for the storage of human tissue, ensuring samples are handled within a robust regulatory framework.
Can assays be tailored to specific project objectives?
Yes. Domainex scientists develop custom assays and staining panels aligned to your scientific objectives, from immune profiling and target engagement to biomarker and translational studies.
Can Domainex develop a new panel if one does not already exist?
Yes. Domainex routinely design and optimise bespoke staining panels tailored to specific project needs.
Can you work with client-provided antibodies or reagents?
Yes. Domainex scientists can use client-supplied reagents or source and recommend reagents as part of assay development.
Do you offer high-parameter or spectral flow cytometry?
Yes. Domainex uses both conventional and spectral flow cytometry to support routine studies and high-parameter analyses.
What is the difference between conventional and spectral flow cytometry?
Conventional flow cytometry detects signals through individual filters, while spectral cytometry captures full fluorescence spectra, enabling larger and more complex panels.
How many markers can be analysed in a single experiment?
The number depends on assay design and study requirements. Domainex supports everything from simple single-colour assays to complex high-parameter panels.
Can intracellular markers be assessed?
Yes. Domainex can analyse intracellular proteins, including transcription factors, signalling proteins and cytokines.
Can rare cell populations be detected?
Yes. Flow cytometry is highly effective for detecting and characterising rare cell populations.
What applications can flow cytometry support in drug discovery?
Applications include immune phenotyping, target engagement, cellular response analysis, cytokine profiling, proliferation, apoptosis, biomarker research and PK/PD studies.
Can these services support translational and biomarker studies?
Yes. Domainex's flow cytometry services support translational research, biomarker assessment, and PK/PD studies across the discovery pipeline.
What data will I receive?
Deliverables are tailored to project needs and may include analysed data, gating strategies, population frequencies and data visualisations.
Can flow cytometry be integrated with other Domainex services?
Yes. Domainex combines flow cytometry our broader biology, translational research and drug discovery capabilities.
Can Domainex support both exploratory and regulated studies?
Domainex supports exploratory and translational research studies aligned to project requirements. Please note that Domainex is not GLP accredited.
Start your next project with Domainex
Contact one of our experts today