- About
-
Solutions
-
Services
-
Biosciences
- PureDisc™ Enabled Membrane Protein Production
- Assay Development and Transfer
- Biochemistry / Enzymology
- Biomarker Services
- Biophysics
- Cell-Based Assays
- Compound screening and cascade design
- Cryo-EM
- Fibrosis Assays
- Project Management and Consultancy Services
- Protein Expression
- Structural Biology
- X-ray Crystallography
- Chemistry
- Integrated Drug Discovery
- Computer Aided Drug Design
- Hit ID and Screening Services
- DMPK Services
-
Biosciences
- Target Classes and Modalities
- Therapeutic Areas
-
A-Z
- A
- B
- C
- D
- E
- F
- G
- H
- I
- K
- L
- M
- N
- O
- P
- R
- S
- T
- V
- X
-
Services
- Library
- News & Events
- Careers
- PureDisc™
PBMC population identification using flow cytometry
Peripheral blood mononuclear cells (PBMCs) were stained with an 8-colour flow panel including a viability dye (for determination of live cells) and fluorescently conjugated antibodies against CD3, CD4, CD8, CD14, CD56, CD16 and CD19. Key immunological cell subsets were identified based on surface marker expression as indicated in the gating strategy shown figure 1.
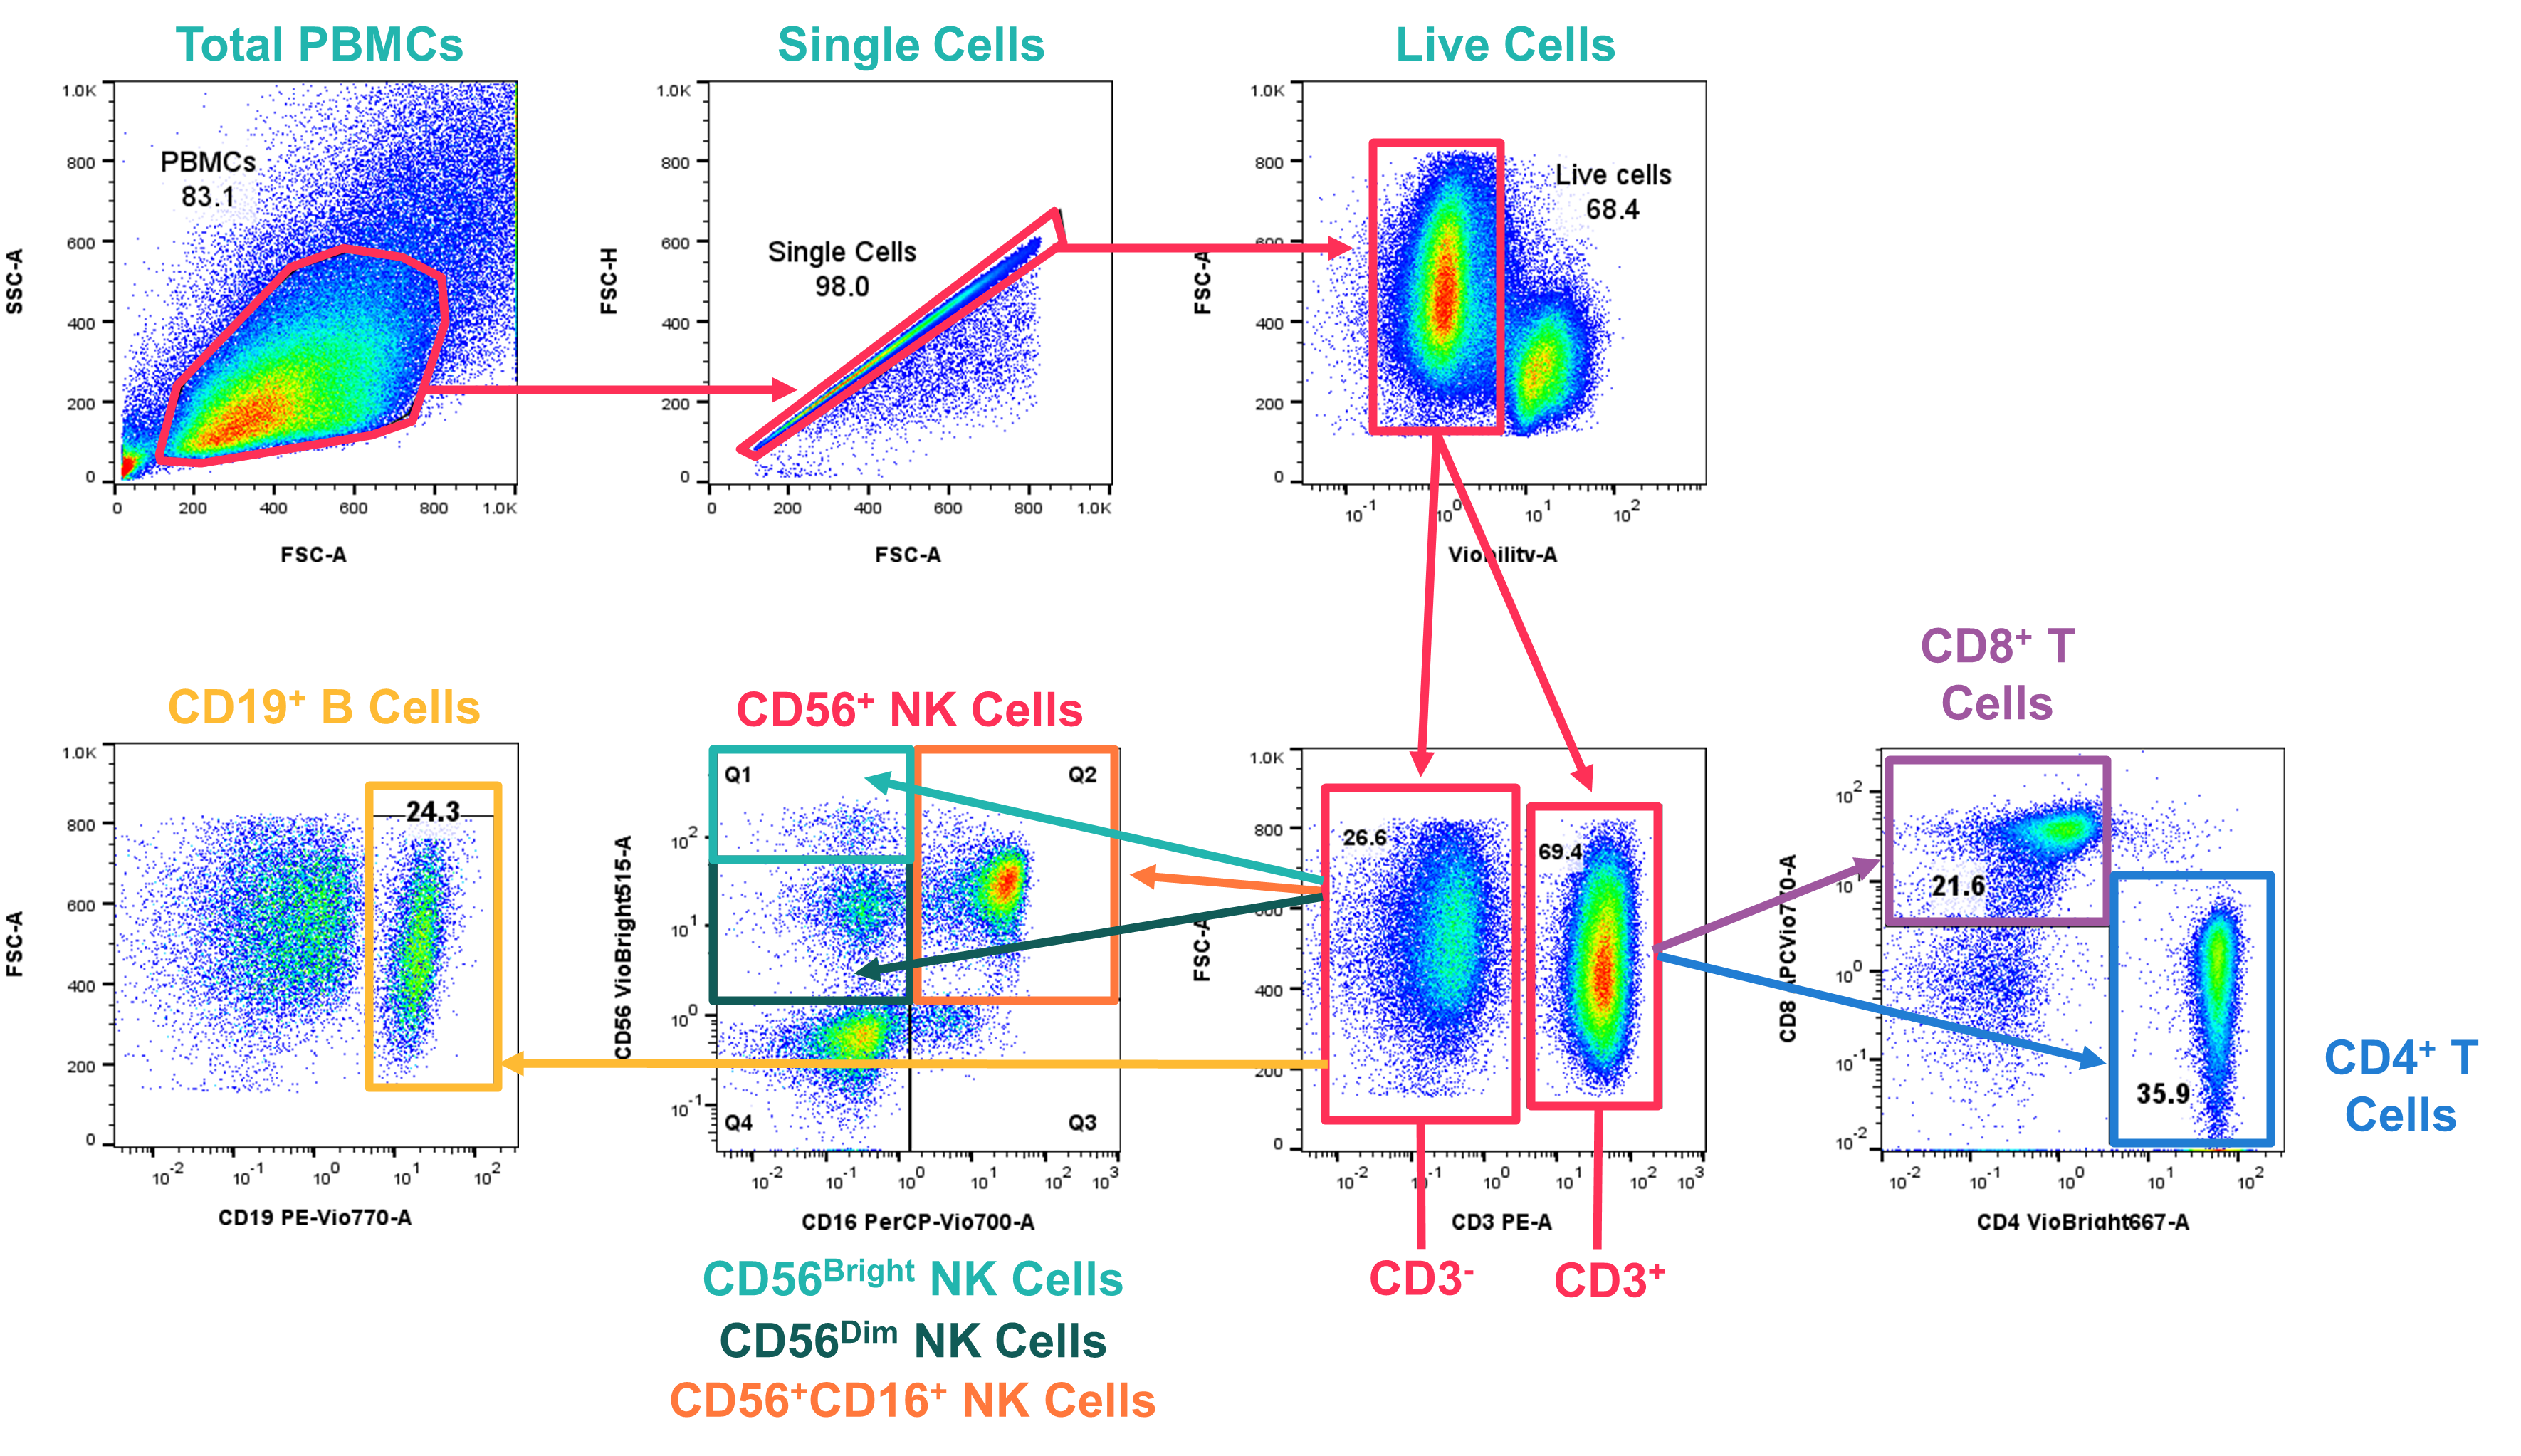
Figure 1: PBMCs were stained with an 8-parameter panel against cell lineage markers to identify different immunological subsets. Bivariate plots were used to identify cell populations; total PBMCs were gated using Forward Scatter Area (FSC-A) vs Side Scatter Area (SSC-A), with doublets then excluded using FSC-A vs Forward Scatter Height (FSC-H). Live cells were then gated into CD3- (non-T cells) and CD3+ (T cells) populations, which were further gated into a range of key immunological cell populations; CD4+ and CD8+ T cells, CD19+ B cells, and CD56+ NK cells (further classified into 3 subpopulations; CD56Bright NK cells, CD56Dim NK cells and CD56+CD16+ NK cells).
The data generated is also displayed in Figure 2 as t-SNE (t-Distributed stochastic neighbour embedding) plots. This approach uses a statistical method to cluster individual cells together, based on their similarity to each other with regards to each marker of interest, into one 2D map. This is especially useful in biomarker discovery or comparison between disease groups.
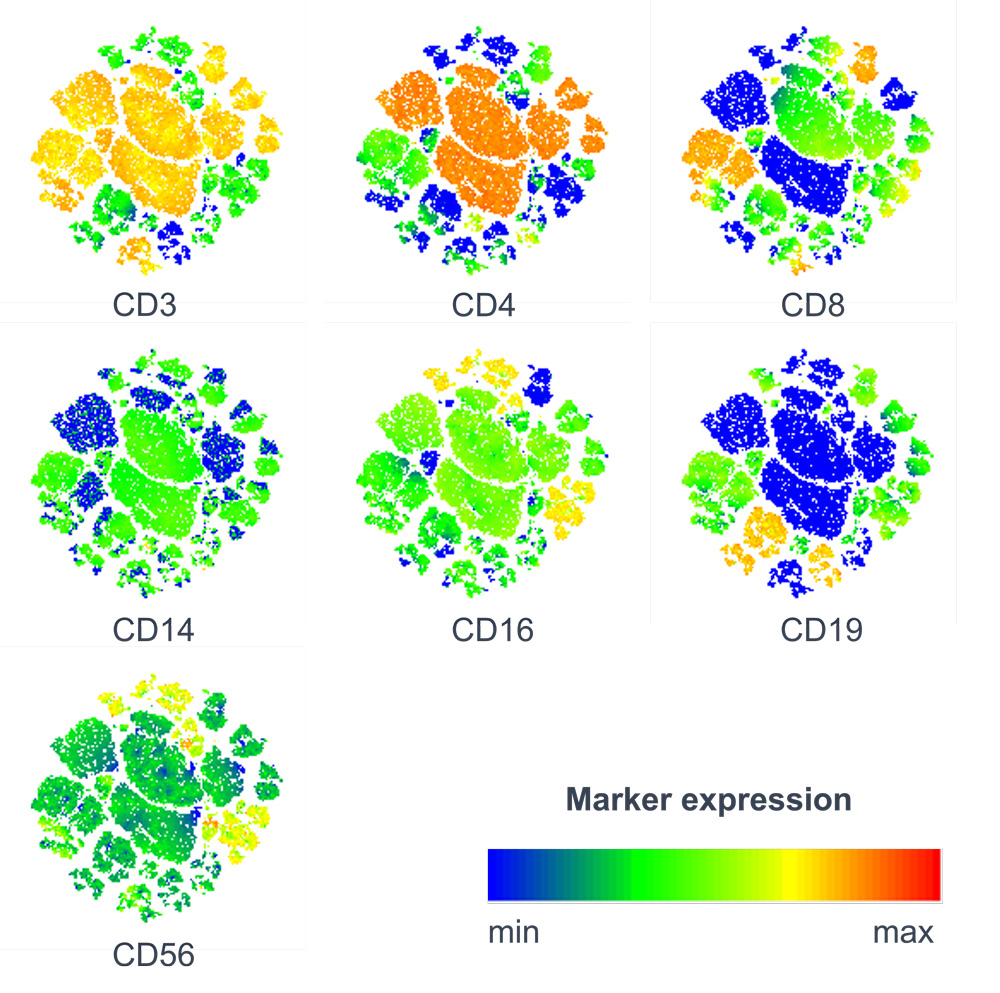
Figure 2: PBMCs were stained with an 8-parameter panel against cell lineage markers to identify different immunological subsets. Bivariate plots were used to identify cell populations. t-SNE plots were generated for 7 biomarkers using heatmaps (shown above).
Total PBMCs were stimulated with ImmunoCult™ Human CD3/CD28 T Cell Activator for 72 hours. Cells were then stained for T cell subset identification and for CD25 and CD69 expression as indicated in Figure 3. Histograms show a clear upregulation of CD25 and CD69 following stimulation. CD25 and CD69 are well characterized T cell activation markers.
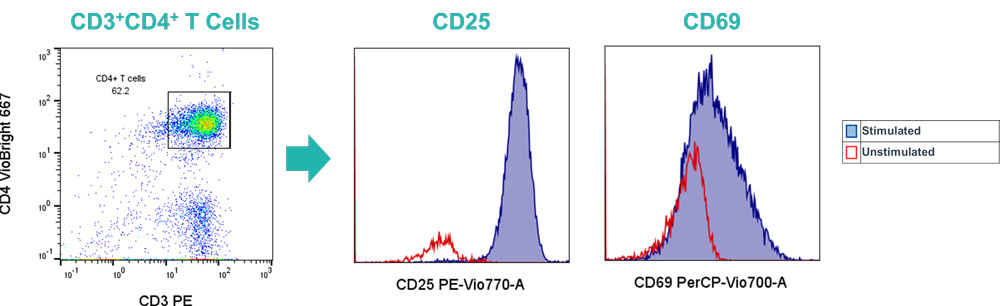
Figure 3: PBMCs were stimulated and stained with a multi-parameter staining panel for T cell identification using flow cytometry. Total PBMCs were gated, with doublets excluded (data not shown), followed by CD3+CD4+ T cell identification. CD3+CD4+ T cells were then examined for CD25 and CD69 expression levels.
Start your next project with Domainex
Contact one of our experts today