- About
-
Solutions
-
Services
-
Biosciences
- PureDisc™ Enabled Membrane Protein Production
- Assay Development and Transfer
- Biochemistry / Enzymology
- Biomarker Services
- Biophysics
- Cellular Biology
- Compound screening and cascade design
- Cryo-EM
- Fibrosis Assays
- Project Management and Consultancy Services
- Protein Expression
- Structural Biology
- X-ray Crystallography
- Chemistry
- Integrated Drug Discovery
- Computer Aided Drug Design
- Hit ID and Screening Services
- DMPK Services
-
Biosciences
- Target Classes and Modalities
- Therapeutic Areas
-
A-Z
- A
- B
- C
- D
- E
- F
- G
- H
- I
- K
- L
- M
- N
- O
- P
- R
- S
- T
- V
- X
-
Services
- Library
- News & Events
- Careers
- PureDisc™
Cytochrome P450 (CYP) Inhibition
Cytochrome P450 (CYP) enzymes are heme-containing mono-oxygenases primarily localised in the liver, responsible for the biotransformation of around 80% of clinically used drugs.
Their catalytic activity represents a critical parameter in drug discovery and development, as modulation of CYP function is a primary contributor to metabolism-mediated drug–drug interactions (DDIs).
Determining whether a new chemical entity inhibits specific CYP isoforms is therefore essential. Co-administration of multiple drugs can lead to competitive or mechanism-based inhibition of CYP-mediated metabolic pathways, resulting in altered systemic exposure, elevated plasma concentrations in vivo, and an increased risk of toxicity or other adverse clinical outcomes.
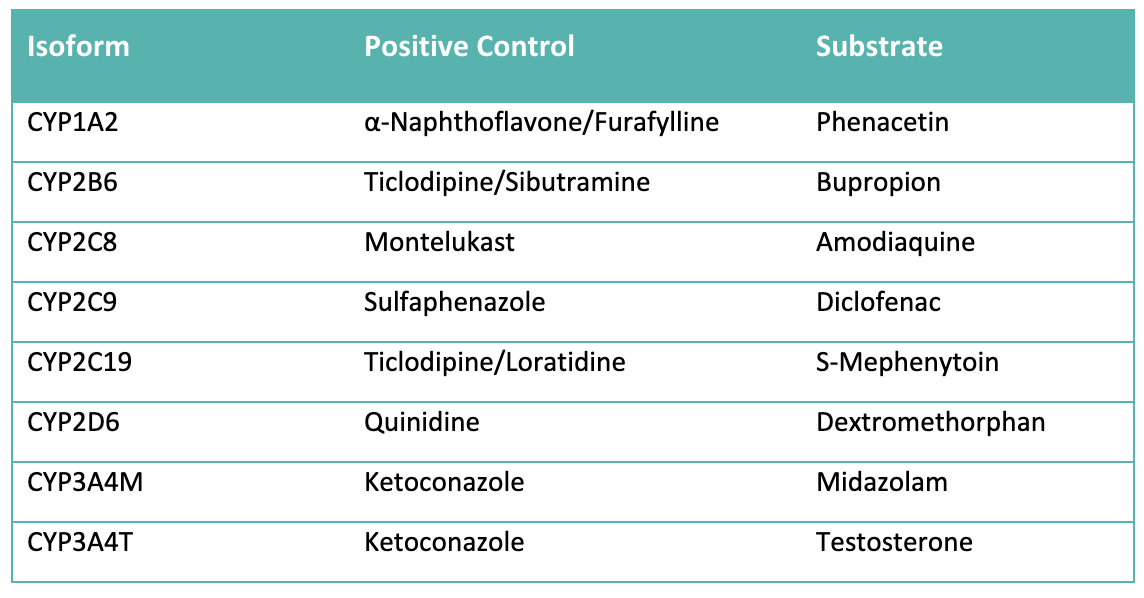
Domainex provides a comprehensive suite of CYP inhibition assays encompassing all major isoforms (CYP1A2, 2B6, 2C8, 2C9, 2C19, 2D6, and 3A4/5). These assays assess inhibitory potency by determining IC₅₀ values based on reductions in the formation of a specific metabolite. The resulting data support robust assessment of DDI liabilities and contribute to the overall safety evaluation of compounds.
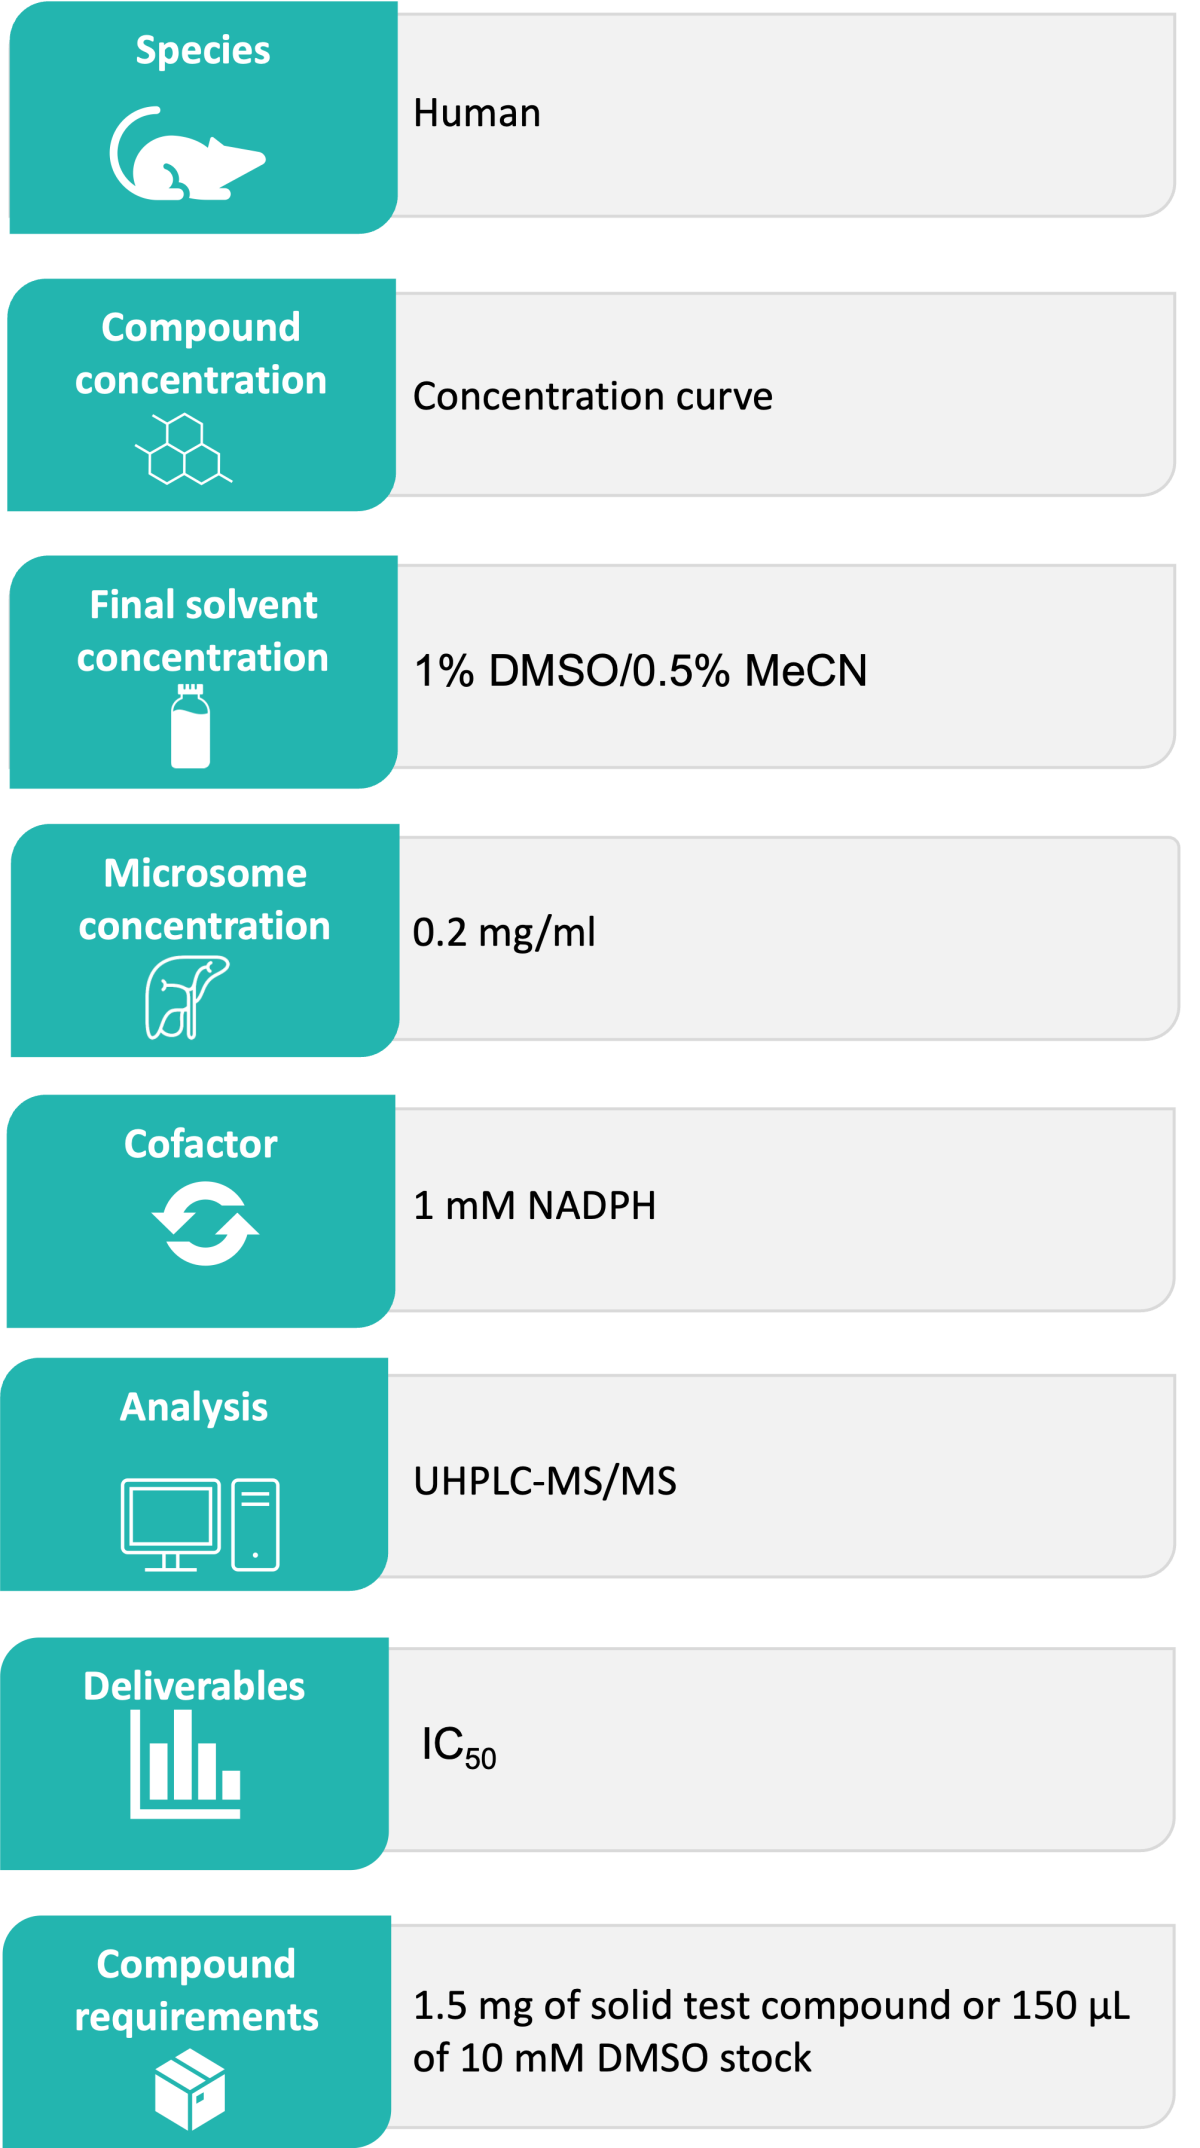
Domainex’s Standard Experimental Procedure:
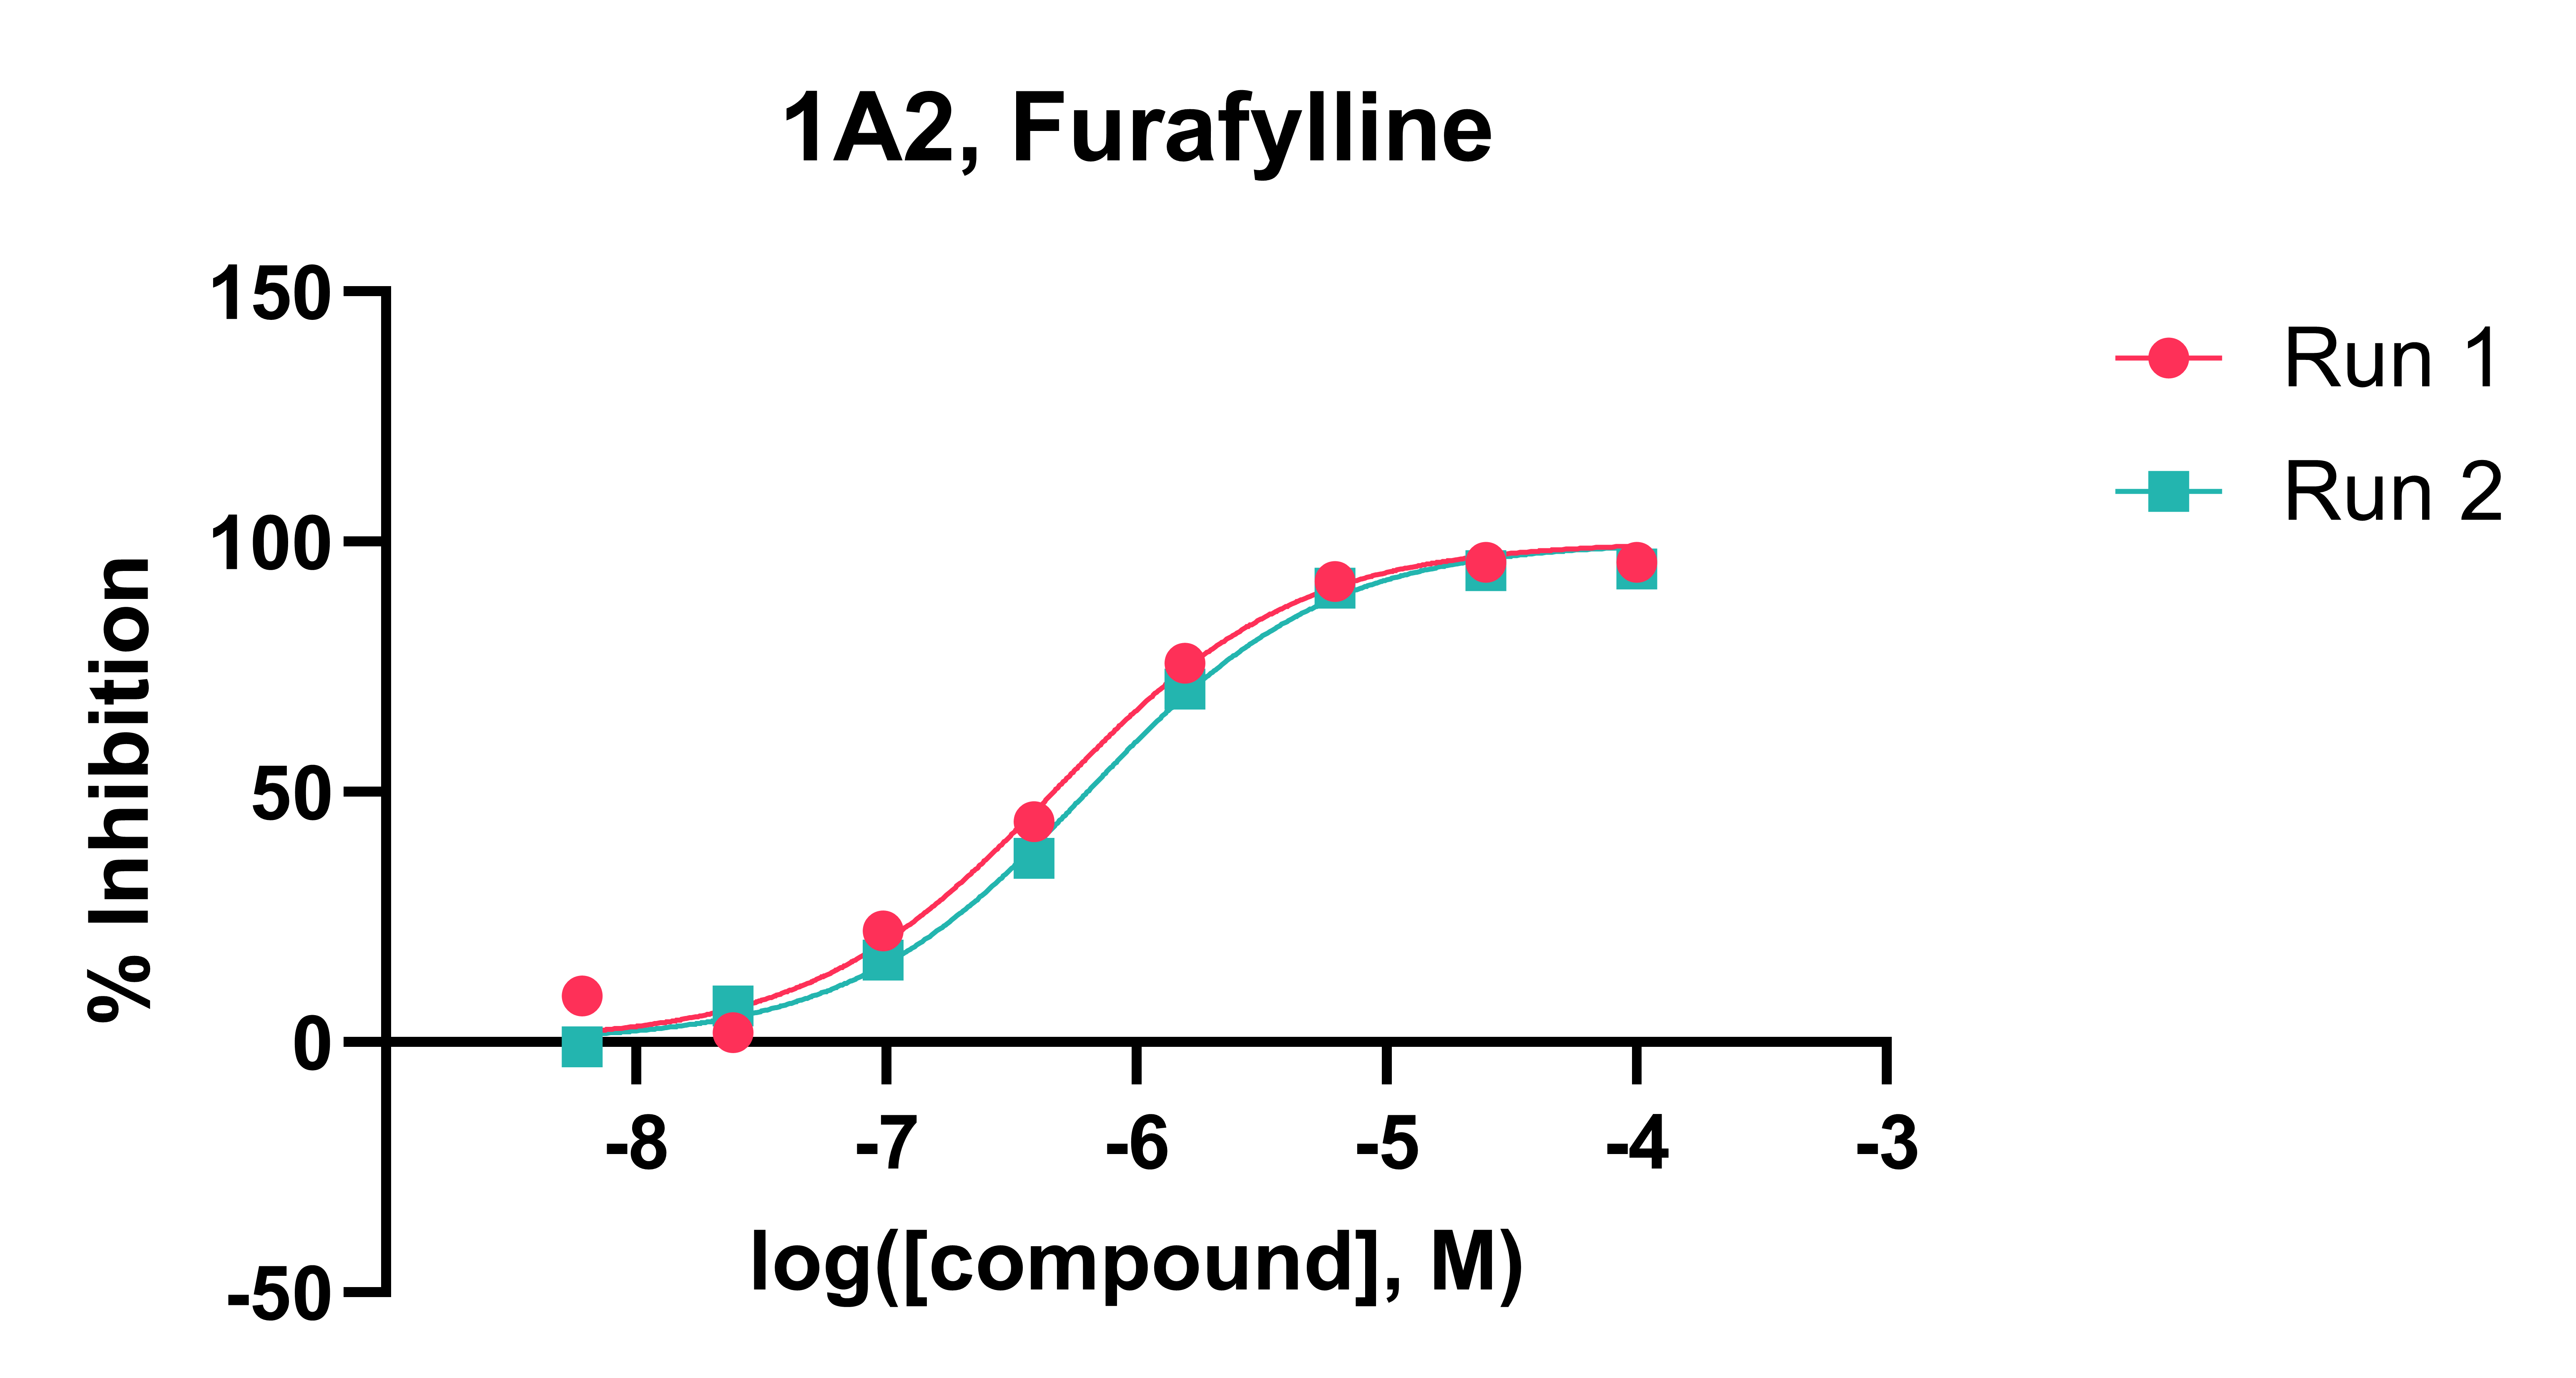
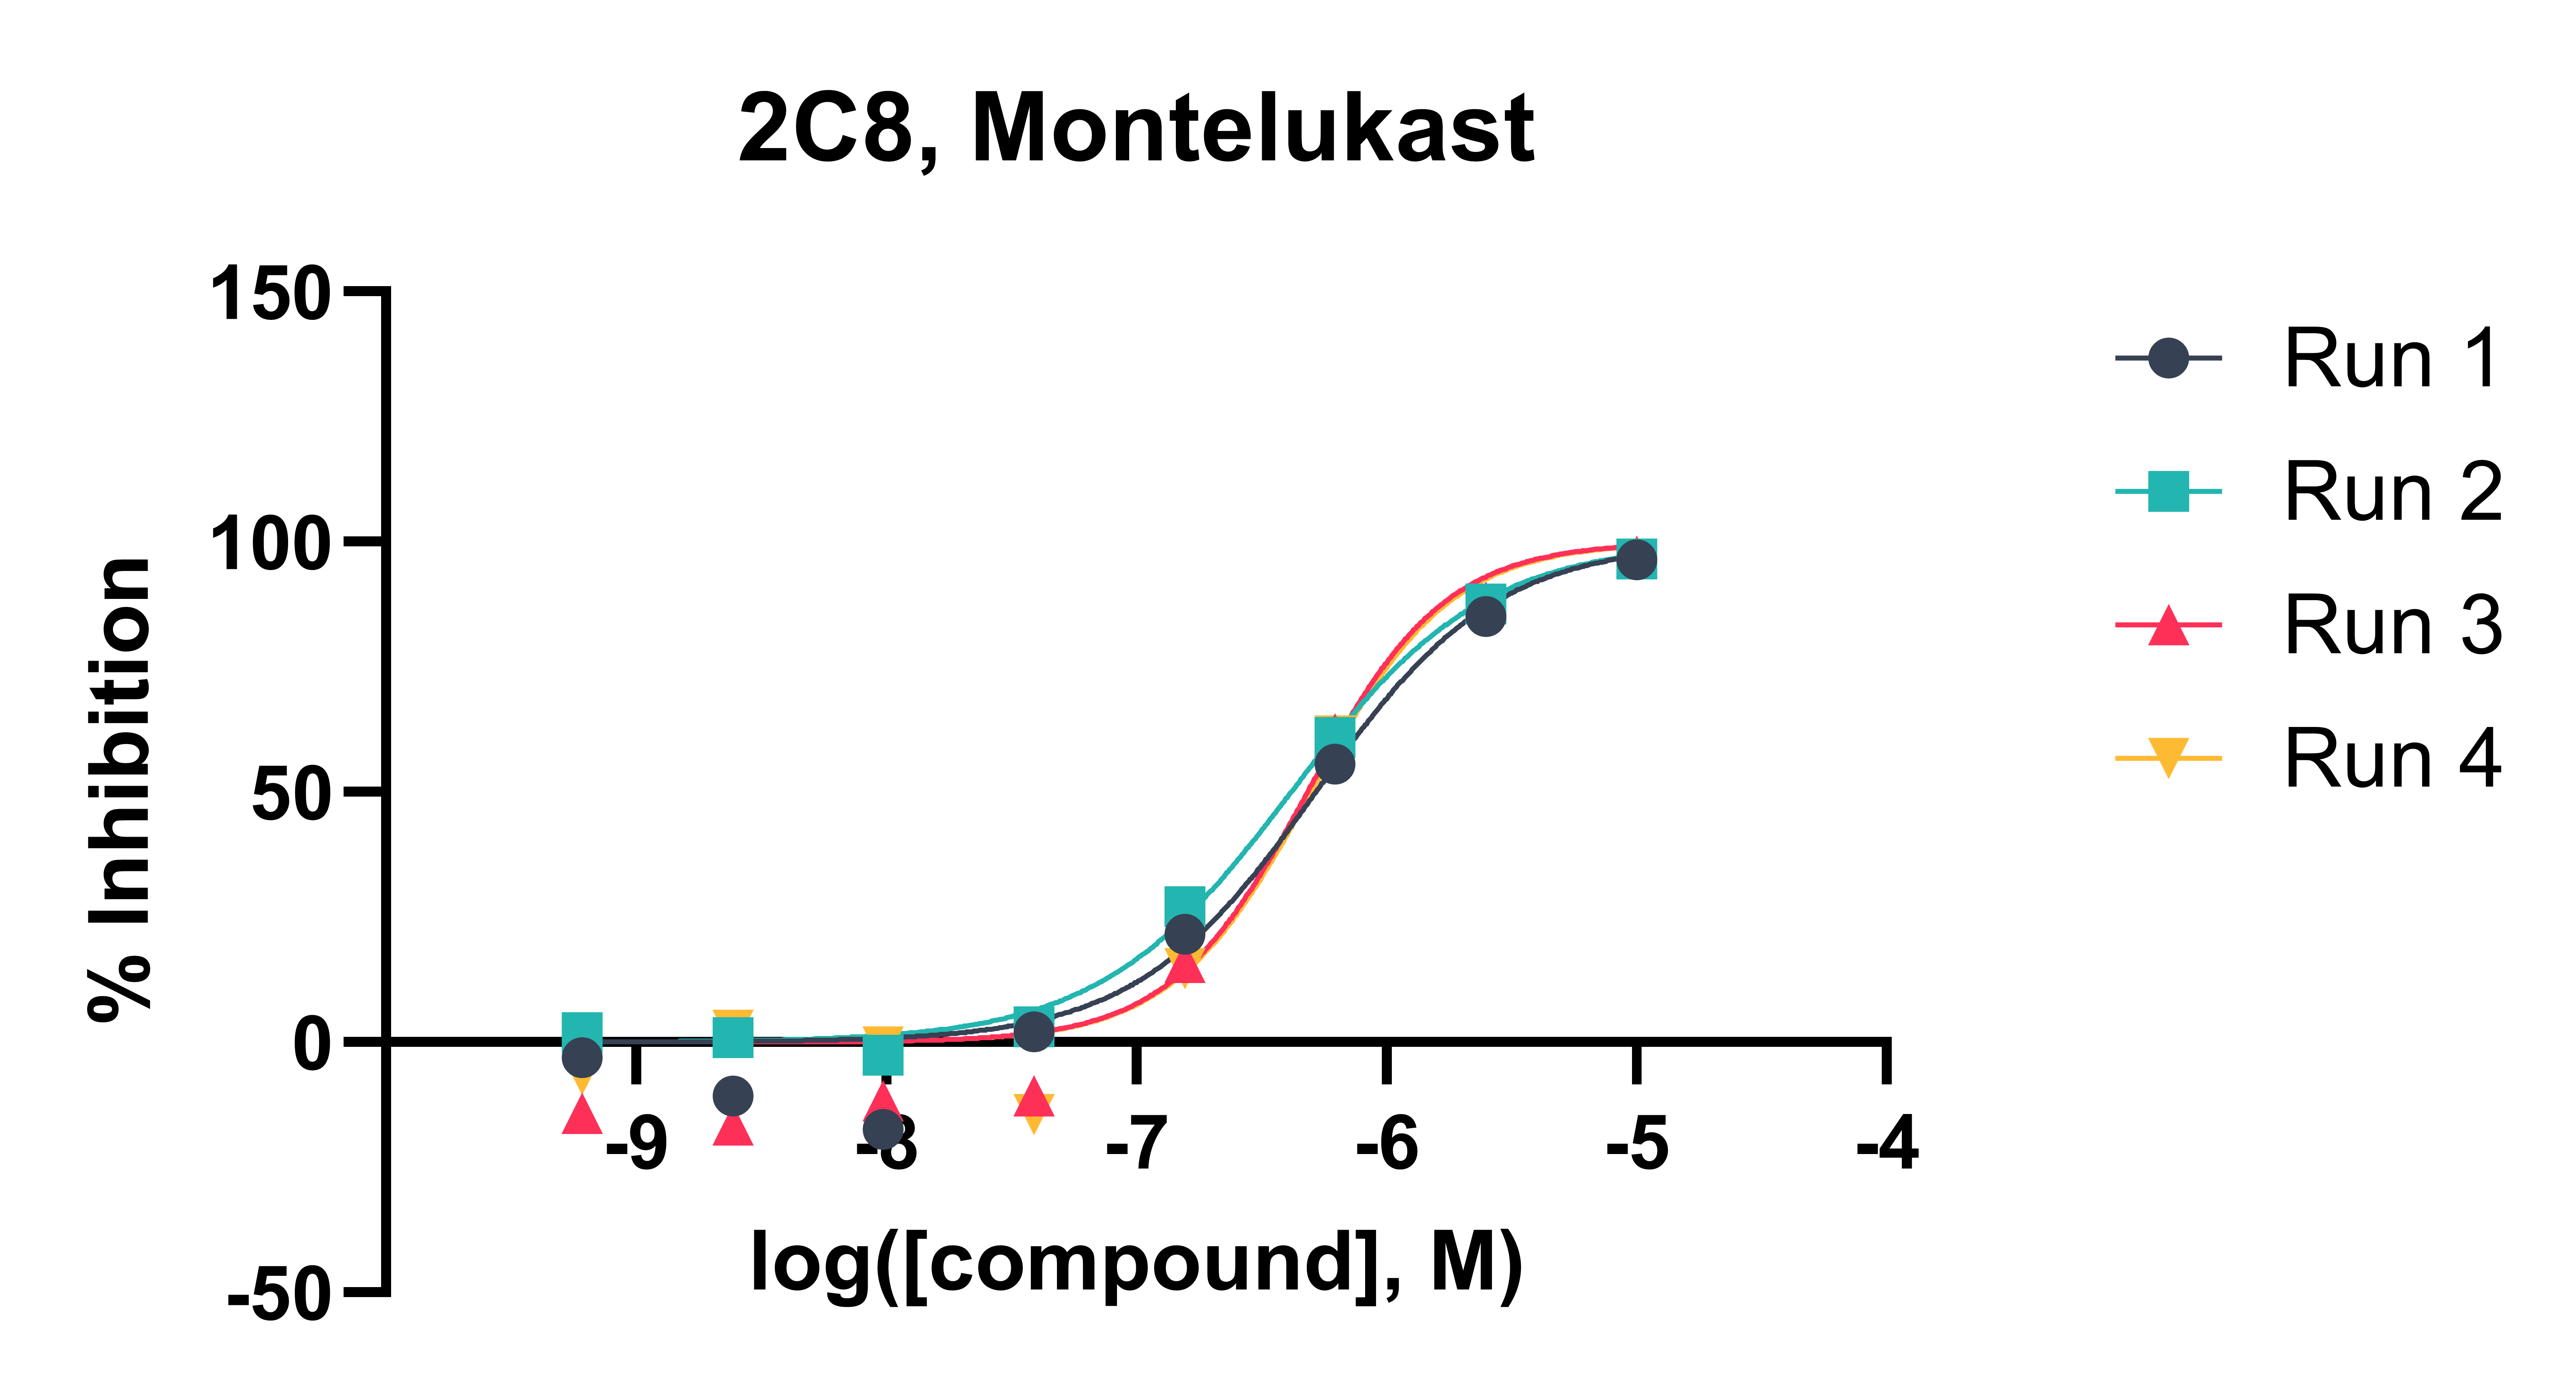
Test compounds are incubated with liver microsomes across a range of concentrations in the presence of CYP isoform-specific substrates (typically ranging from 0.6 µM to 10 mM) and NADPH cofactor at 37 °C. The reaction mixture is sampled at 10 minutes into a cold stop plate containing acetonitrile/water and an internal standard. Control compounds with established IC₅₀ values are analysed alongside test compounds to confirm that CYP inhibition activity is within the expected range. The samples are analysed by Ultra-High Performance Liquid Chromatography (UHPLC)-mass spectrometry (MS). CYP-specific substrates and inhibitors are shown in Table 1. Typical CYP inhibition data is shown in Figures 1 and 2.
Data Analysis:
Microsomal incubation extracts are analysed using Waters Acquity UHPLC TQ-S, TQS-micro or TQ-XS instruments to monitor metabolite production relative to the vehicle control to determine the IC₅₀ value. Triple quadrupole mass spectrometers, operated in multiple reaction monitoring (MRM) mode, provide accurate measurement with excellent sensitivity, selectivity and reproducibility.
Deliverables:
The results are reported in Excel file format as IC50 values including standard error of mean (SEM). Any relevant comments about compound stability, solubility or binding are also included in the report as comments.
Start your next project with Domainex
Contact one of our experts today