- About
-
Solutions
-
Services
-
Biosciences
- PureDisc™ Enabled Membrane Protein Production
- Assay Development and Transfer
- Biochemistry / Enzymology
- Biomarker Services
- Biophysics
- Cell-Based Assays
- Compound screening and cascade design
- Cryo-EM
- Fibrosis Assays
- Project Management and Consultancy Services
- Protein Expression
- Structural Biology
- X-ray Crystallography
- Chemistry
- Integrated Drug Discovery
- Computer Aided Drug Design
- Hit ID and Screening Services
- DMPK Services
-
Biosciences
- Target Classes and Modalities
- Therapeutic Areas
-
A-Z
- A
- B
- C
- D
- E
- F
- G
- H
- I
- K
- L
- M
- N
- O
- P
- R
- S
- T
- V
- X
-
Services
- Library
- News & Events
- Careers
- PureDisc™
Aldehyde Oxidase Stability Assay
The inherent lipophilicity of many drug candidates renders them susceptible to extensive metabolism mediated by cytochrome P450 (CYP) enzymes. As medicinal chemistry strategies become increasingly successful at mitigating CYP-mediated clearance, this can inadvertently increase susceptibility towards alternative metabolic pathways, notably those involving non-CYP enzymes such as Aldehyde Oxidase (AO).
A hallmark of AO-mediated metabolism is a discrepancy in compound turnover between liver microsomes and hepatocytes, with accelerated degradation typically observed in hepatocyte incubations.
AO is a cytosolic molybdenum flavoenzyme that operates independently of NADPH. It utilises a unique molybdenum cofactor (MoCo) in conjunction with flavin adenine dinucleotide (FAD) to facilitate catalytic activity. AO exhibits broad substrate specificity, catalysing the oxidation of aldehydes to carboxylic acids and the hydroxylation of nitrogen-containing heterocycles.
Measuring AO-mediated clearance can determine the extent of cytosolic biotransformation, enabling a more thorough understanding of the metabolic fate of the compound.
Experimental Procedure:
Test compounds are incubated with a suspension of liver cytosol at 37 °C. The reaction mixture is sampled at allocated timepoints into a cold stop plate containing acetonitrile and internal standard. The samples are subsequently analysed by Ultra-High Performance Liquid Chromatography (UHPLC)-Mass Spectrometry (MS), monitoring the depletion of test compound. Two assay standards are also assessed in each run to ensure intrinsic clearance values fall within the acceptance criteria. Example AO stability data is shown in in Figures 1 and 2.
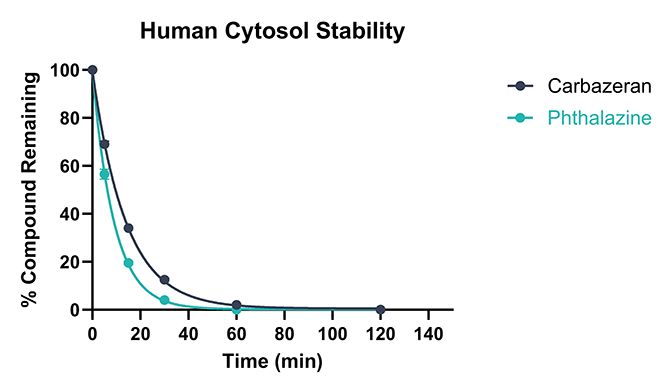
Figure 1. Example data showing depletion of test compounds following incubation with human cytosol.
* Other options available upon request
A
B
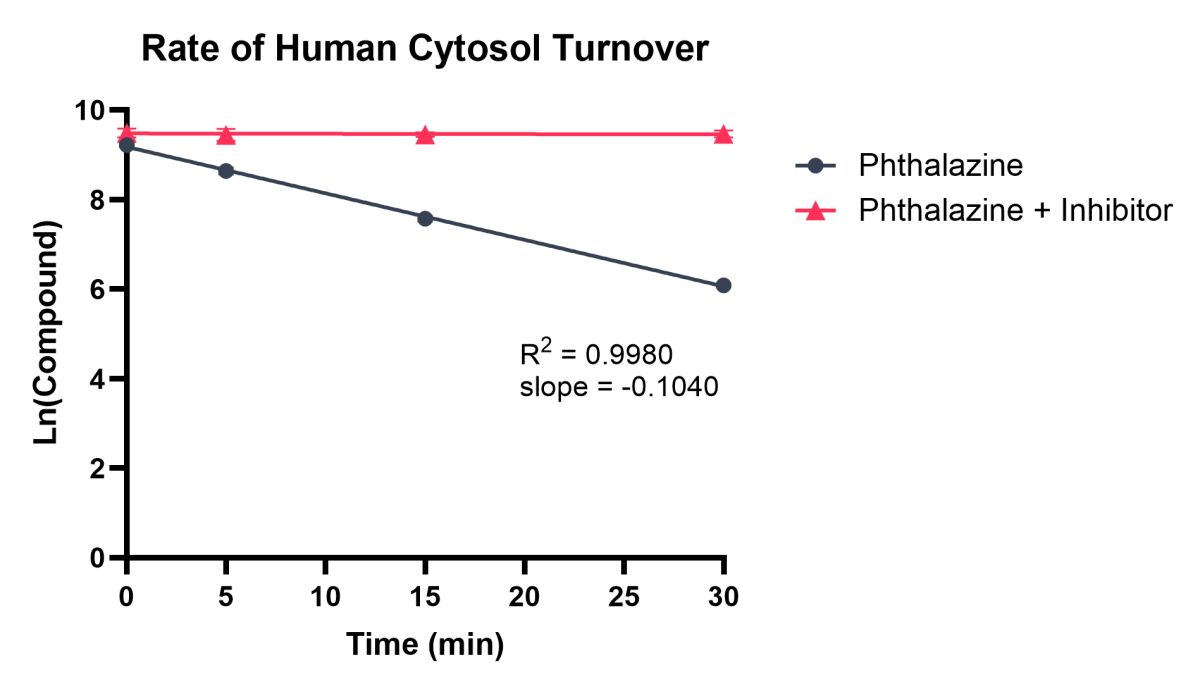
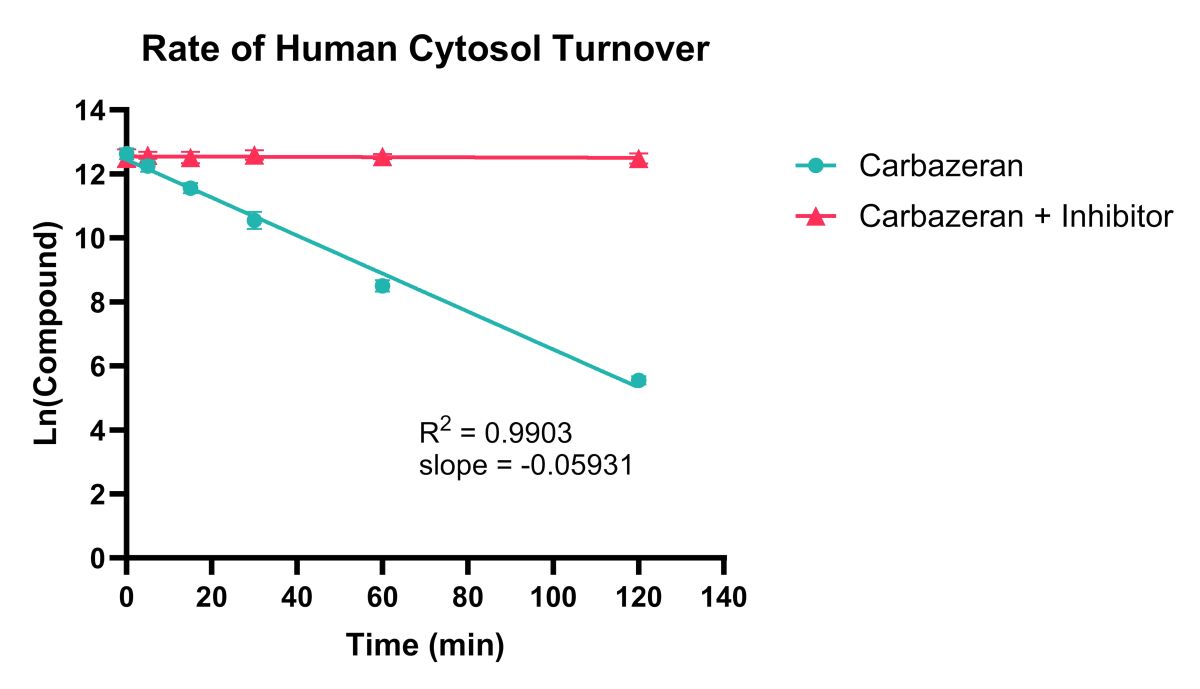
Figure 2. Example data showing rate of compound turnover in human cytosol for Carbazeran (A) and Phthalazine (B) with/without an AO inhibitor (Raloxifene). Natural Log linear plots of compound turnover allow t1/2 and CLint,app values to be calculated.
Data Analysis:
Cytosol incubation extracts are analysed using Waters Acquity UHPLC TQ-S, TQS-micro or TQ-XS instruments. Triple quadrupole mass spectrometers operated in multiple reaction monitoring (MRM) mode, provide accurate measurement with excellent sensitivity, selectivity and reproducibility.
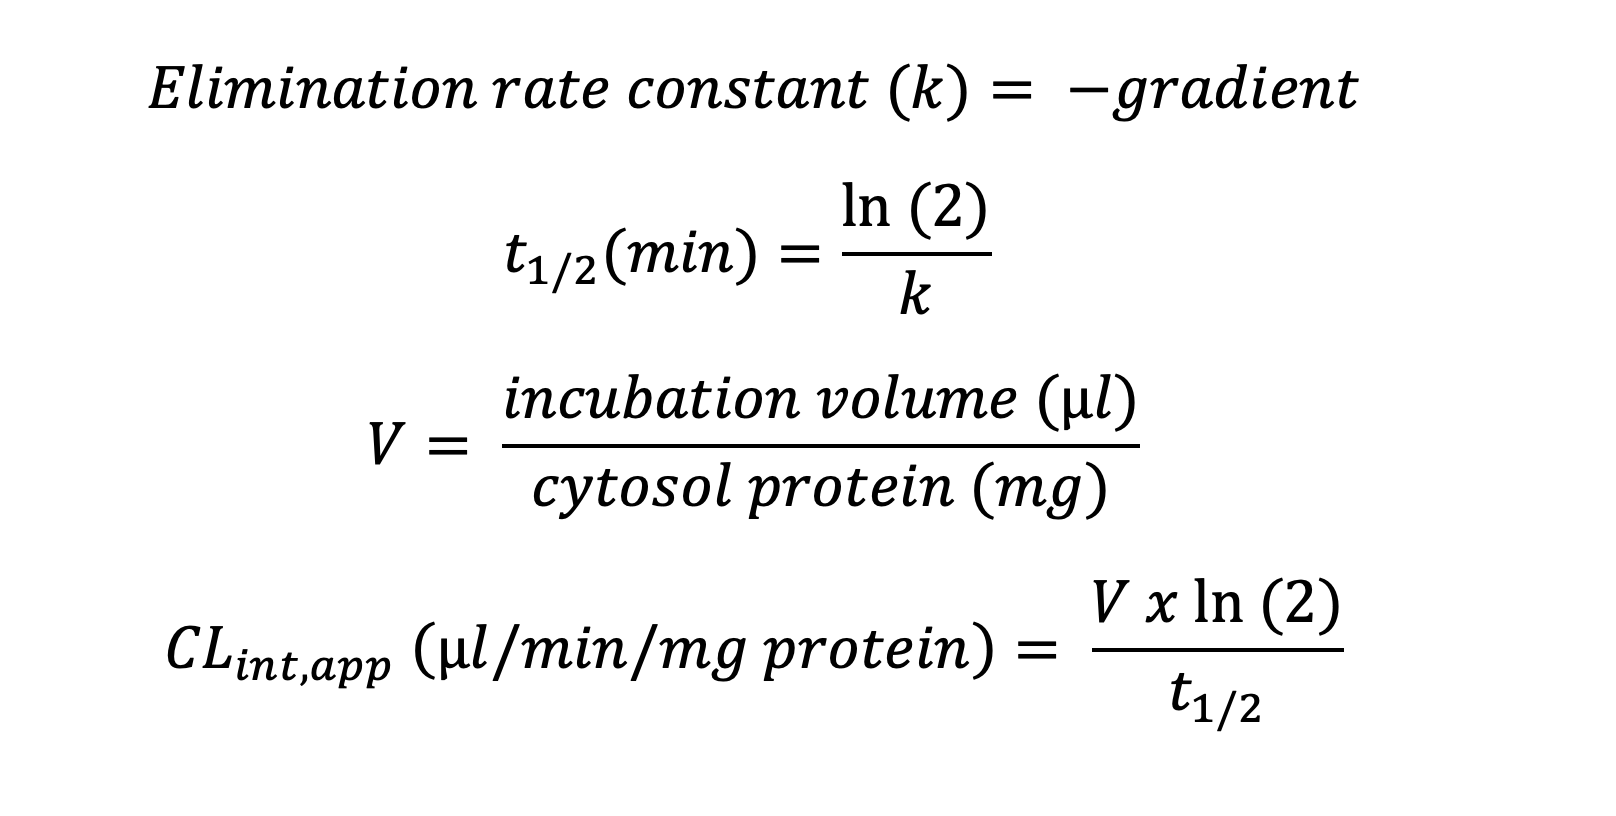
Plotting the natural logarithm (ln) of compound response against time allows the determination of half-life (t1/2) and apparent intrinsic clearance (CLint, app) using the equations below:
Deliverables:
The results are reported in Excel file format as CLint, app (µl/min/mg protein), t1/2 (min), presence of oxidative metabolite formation and parent remaining (%) at T = 120 min in the presence and absence of inhibitor, including standard error of mean (SEM). Any relevant comments about compound stability, solubility and/or binding are also included in the report.
Typical turnaround time from receipt of test compounds to release of data is ten working days or less.
Start your next project with Domainex
Contact one of our experts today