- About
-
Solutions
-
Services
-
Biosciences
- PureDisc™ Enabled Membrane Protein Production
- Assay Development and Transfer
- Biochemistry / Enzymology
- Biomarker Services
- Biophysics
- Cell-Based Assays
- Compound screening and cascade design
- Cryo-EM
- Fibrosis Assays
- Project Management and Consultancy Services
- Protein Expression
- Structural Biology
- X-ray Crystallography
- Chemistry
- Integrated Drug Discovery
- Computer Aided Drug Design
- Hit ID and Screening Services
- DMPK Services
-
Biosciences
- Target Classes and Modalities
- Therapeutic Areas
-
A-Z
- A
- B
- C
- D
- E
- F
- G
- H
- I
- K
- L
- M
- N
- O
- P
- R
- S
- T
- V
- X
-
Services
- Library
- News & Events
- Careers
- PureDisc™
Hepatocyte Stability Assay
Metabolism is a major clearance mechanism that primarily occurs in the liver, so it is important to measure and optimise the hepatic metabolic stability or apparent intrinsic clearance (CLint, app) of test compounds in vitro.
Domainex offers microsomal, S9 and hepatocyte stability assays, and while all of these assays provide CLint, app data, the hepatocyte stability assay mimics the in vivo system much more closely. Unlike microsomes, which contain only phase I enzymes, hepatocytes are a whole cell system that contain both phase I and phase II enzymes alongside the necessary co-factors. In addition, hepatocyte stability takes permeability across the cell membrane into account, which is relevant for in vivo metabolic clearance. Measuring hepatocyte clearance not only assists in ranking/triaging compounds for in vivo studies but can also help to predict in vivo hepatic clearance and human dose.
Alternatively, liver S9 or microsomal fractions can be used to predict hepatic compound stability.
Domainex’s Standard Experimental Procedure:
Test compounds are incubated with a suspension of liver hepatocytes at 37 °C. The reaction mixture is sampled at allocated timepoints into a cold stop plate containing acetonitrile and internal standard. The samples are subsequently analysed by Ultra-High Performance Liquid Chromatography (UHPLC)-Mass Spectrometry (MS), monitoring the depletion of test compound. Two controls are also assessed in each run (one for Phase I and one for Phase II metabolism) to ensure intrinsic clearance values fall within the acceptance criteria. Example hepatocyte stability data is shown in Figure 1 and Figure 2.
Figure 1: Example data showing depletion of test compounds following incubation with human hepatocytes.
Figure 2: Example data showing rate of compound turnover in human hepatocytes for Umbelliferone (A) and Verapamil (B). Natural Log linear plots of compound turnover allow t1/2 and Clint,app values to be calculated.
Data Analysis:
Hepatocyte incubation extracts are analysed using Waters Acquity UPLC TQ-S, TQS-Micro or TQ-XS instruments. Triple quadrupole mass spectrometers, operated in multiple reaction monitoring (MRM) mode, provide accurate measurements with excellent sensitivity, selectivity and reproducibility.
Plotting the natural logarithm (ln) of compound response against time allows the determination of half-life (t1/2) and apparent intrinsic clearance (CLint, app) using the equations below:
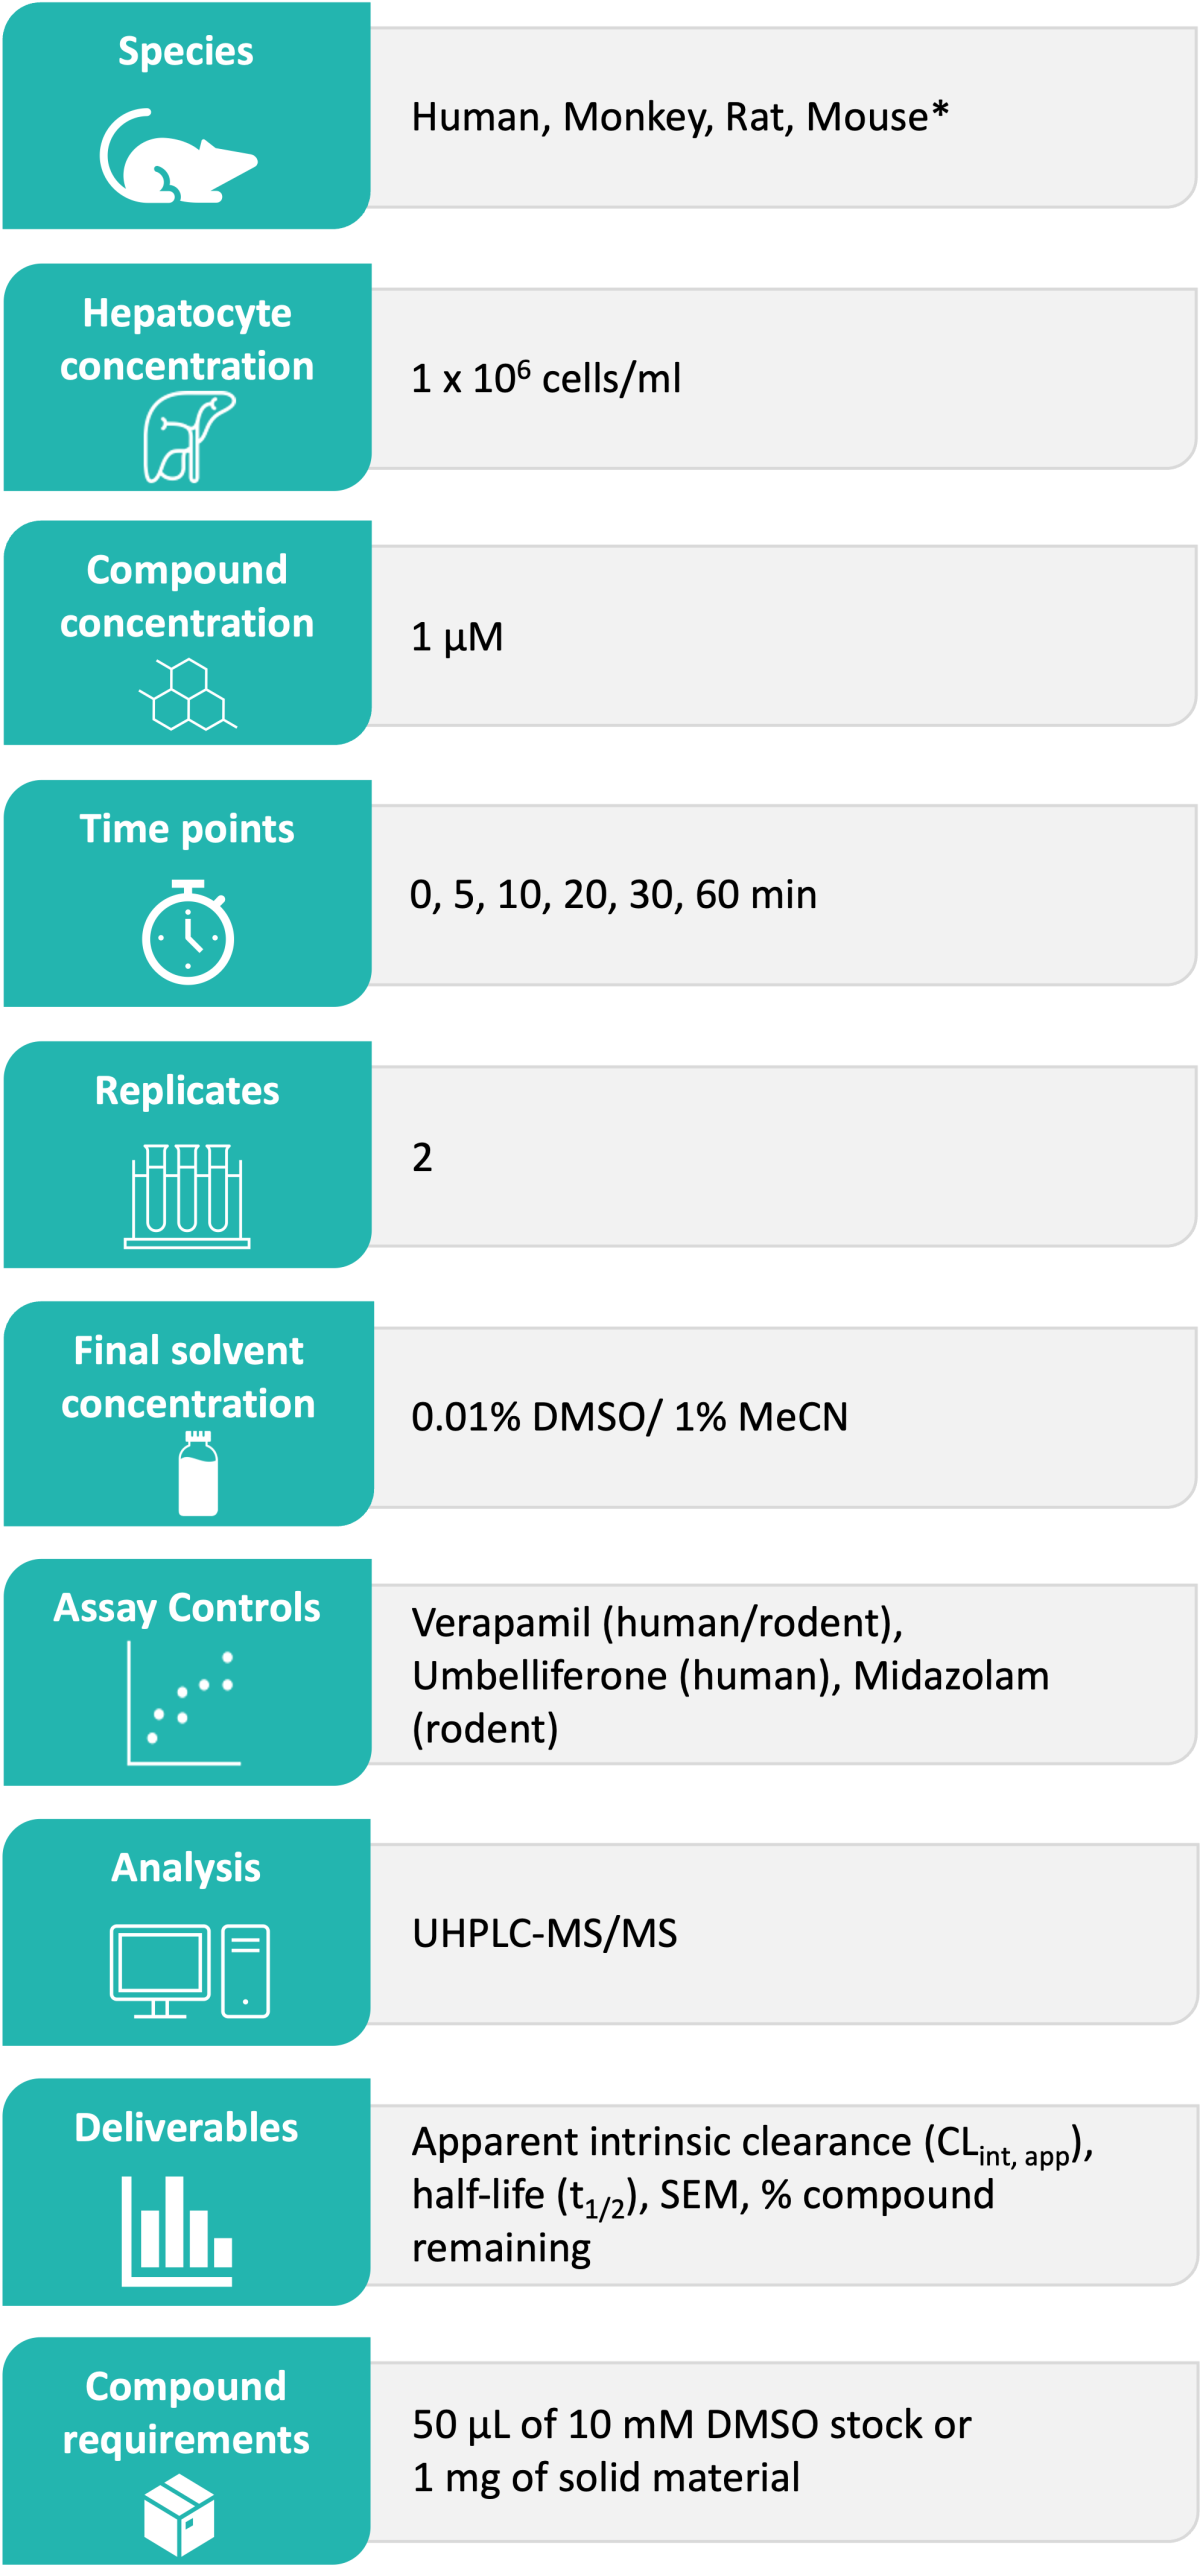
* Other options available upon request
Deliverables:
Typical turnaround time from receipt of test compounds to release of data is ten working days or less. The results are reported in Excel file format as CLint, app (µl/min/106 cells), half-life (mins) and parent remaining (%) at T= 60 min including standard error of mean (SEM). Any relevant comments about compound stability, solubility or binding are also included in the report.
Start your next project with Domainex
Contact one of our experts today