- About
-
Solutions
-
Services
-
Biosciences
- PureDisc™ Enabled Membrane Protein Production
- Assay Development and Transfer
- Biochemistry / Enzymology
- Biomarker Services
- Biophysics
- Cellular Biology
- Compound screening and cascade design
- Cryo-EM
- Fibrosis Assays
- Project Management and Consultancy Services
- Protein Expression
- Structural Biology
- X-ray Crystallography
- Chemistry
- Integrated Drug Discovery
- Computer Aided Drug Design
- Hit ID and Screening Services
- DMPK Services
-
Biosciences
- Target Classes and Modalities
- Therapeutic Areas
-
A-Z
- A
- B
- C
- D
- E
- F
- G
- H
- I
- K
- L
- M
- N
- O
- P
- R
- S
- T
- V
- X
-
Services
- Library
- News & Events
- Careers
- PureDisc™
Confirmation of THP1 cell differentiation by flow cytometry
THP1 cells are a monocytic cell line which can be differentiated to a macrophage like phenotype using phorbol 12-myristate 13-acetate (PMA). Using flow cytometry, Domainex confirmed successful differentiation of cells, using forward scatter (FSC) vs side scatter (SSC) plots, and histograms showing expression levels of different surface markers.
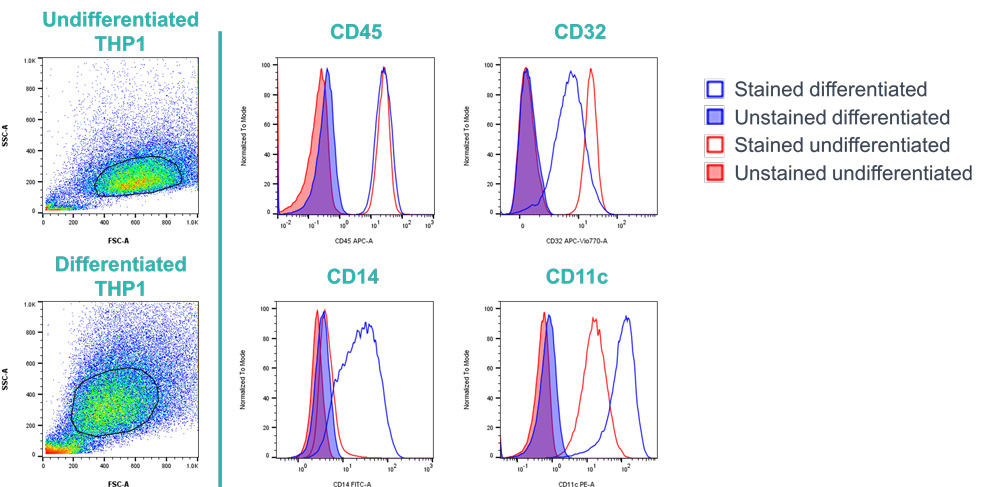
Figure 1: Dot plots and histograms showing differences in morphology and surface marker expression between differentiated and undifferentiated THP1 cells. Cells were initially gated using Forward Scatter Area (FSC-A) vs Side Scatter Area (SSC-A) (left hand plots), followed by doublet exclusion (not shown), and then examined for surface marker expression (CD45, CD32, CD14, and CD11c) using histograms for each marker of interest with unstained cells used as controls.
FSC vs SSC pseudo-colour dot plots (left hand panel) show an increase in granularity/complexity upon PMA differentiation indicative of macrophage morphology. Histograms for CD45 (common leukocyte antigen), CD32 (FcγRII), CD14 (TLR4 coreceptor) and CD11c (complement receptor 4) surface marker expression also show differences between differentiated (macrophage like phenotype) and undifferentiated (monocyte like phenotype) THP1s. Data indicates THP1 cells have the following phenotypes:
- Undifferentiated THP1: CD35-CD45+CD32++CD14-CD11c+
- Differentiated THP1: CD35-CD45+CD32+CD14+CD11c+
Following PMA differentiation, THP1 cells were stimulated with a lipopolysaccharide (LPS) dilution series for several time points (1, 6, 18, 24 and 48 hours). Following set incubation with LPS, and a protein transport inhibitor to prevent cytokine release, cells were stained for TNF-α production (using intracellular staining), with results indicating that 6- or 48-hour stimulation is optimal for TNF-α production.
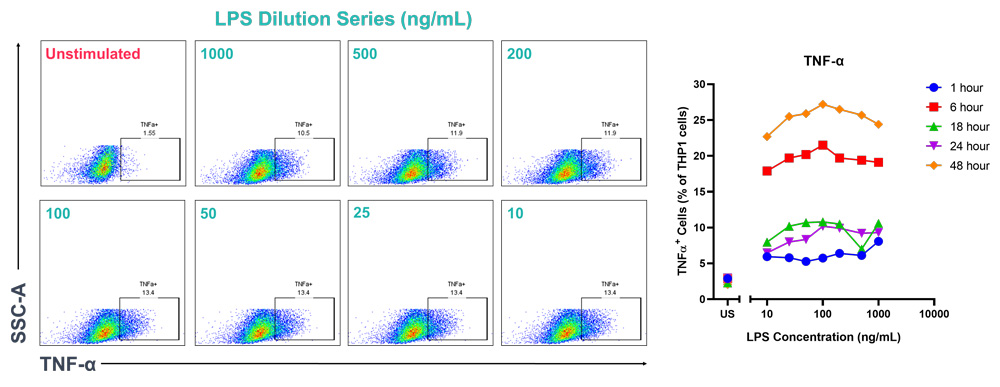
Figure 2: Effect of LPS on TNF-α production in PMA differentiated THP1 cells. The left-hand panel shows 6-hour incubation timepoint with dot plots shown for each LPS concentration and gated TNF-α positive population. The right-hand panel show the percentage of THP1 cells that were positive for TNF-α at each timepoint following stimulation with LPS.
Start your next project with Domainex
Contact one of our experts today